| Check the appropriate box: | ||||||||||||||||||
| o | Preliminary Proxy Statement | |||||||||||||||||
| o | Confidential, for Use of the Commission Only (as permitted by Rule 14a-6(e)(2)) | |||||||||||||||||
| ý | Definitive Proxy Statement | |||||||||||||||||
| o | Definitive Additional Materials | |||||||||||||||||
| o | Soliciting Material under §240.14a-12 | |||||||||||||||||
| ARCH CAPITAL GROUP LTD. | ||||||||||||||||||
| (Name of Registrant as Specified In Its Charter) | ||||||||||||||||||
| Not Applicable | ||||||||||||||||||
| (Name of Person(s) Filing Proxy Statement, if other than the Registrant) | ||||||||||||||||||
| Payment of Filing Fee (Check | ||||||||||||||||||
| ý | No fee required. | |||||||||||||||||
| o | Fee paid previously with preliminary materials. | |||||||||||||||||
| o | Fee computed on table | |||||||||||||||||
 | ||||||||
| Arch Capital Group Ltd. | ||||||||
| Waterloo House, Ground Floor | ||||||||
| 100 Pitts Bay Road | ||||||||
| Pembroke HM 08, Bermuda | ||||||||
| T: (441) 278-9250 | ||||||||
| March 28, | ||

 |
 | ||
  | ||
Conyers Corporate Services (Bermuda) Limited Secretary | ||
| Hamilton, Bermuda | ||
| March 28, | ||
  | Go to the website listed on your proxy card or Notice to vote VIA THE INTERNET. | ||||
  | Call the telephone number specified on your proxy card or on your Voting Instruction Form to vote BY TELEPHONE. | ||||
  | If you received paper copies of your proxy materials, mark, sign, date and return your proxy card in the postage-paid envelope provided to vote BY MAIL. | ||||
  | Scan the QR Code on your proxy card, Notice or Voting Instruction Form to vote with your MOBILE DEVICE. | ||||
  | Attend the virtual meeting to vote | ||||
 | Important Notice Regarding Annual Meeting To log in to the Annual Meeting as a shareholder, a control number will be required. For registered shareholders, the control number can be found on your proxy card, Voting Instruction Form or Notice to shareholders. | ||||
Any questions for the Annual Meeting must be submitted in advance at shareholderinfo@archgroup.com by 11:59 p.m. Eastern Daylight Time on May 6, 2024. | ||
| Important Notice Regarding the Availability of Proxy Materials for the Annual Meeting: | ||
This | ||
| 3 | ||||||||
 |  | |||||||
| PROXY SUMMARY | |||||
| Roadmap of Voting Matters | |||||
| Director Nominees | |||||
| General Information | |||||
| Learn More About Our Company | |||||
| GOVERNANCE | |||||
| Item | |||||
| Board | |||||
| Committees of the Board | |||||
| Nominees | |||||
| Appointed Directors, Continuing Directors and Senior Management | |||||
| Certain Relationships and Related Person Transactions | |||||
| SHARE OWNERSHIP | |||||
| Security Ownership of Certain Beneficial Owners and Management | |||||
| Common Shares | |||||
| Preferred Shares | |||||
| COMPENSATION | |||||
| Item | |||||
| Compensation Discussion and Analysis | |||||
| 2023 Performance at a Glance | |||||
| Long-Term Performance | |||||
| Executive Compensation Philosophy | |||||
| How We Make Compensation Decisions | |||||
| Shareholder Engagement and Results of Say-on-Pay Votes | |||||
| Elements of Compensation Program | |||||
| 2023 Compensation | |||||
| Report of the Compensation and Human Capital Committee on the Compensation Discussion and Analysis | |||||
| Executive Compensation | |||||
| AUDIT MATTERS | |||||
| Report of the Audit Committee of the Board | |||||
| Principal Auditor Fees and Services | |||||
| Item | |||||
| Item | |||||
| Nominees | |||||
ANNEX | A- | ||||
ANNEX | |||||
B- | |||||
 | 2024 PROXY STATEMENT | | 4 | ||||||
| 5 | | | | ||||||
| ROADMAP OF VOTING MATTERS | |||||
| Our Board’s Recommendation | |||||
| The Arch Capital Board of Directors (the “Board”) and the Nominating and Governance Committee of the Board believe that the | FOR | ||||
The Company seeks a non-binding advisory vote to approve the compensation of its named executive officers as described in the Compensation Discussion and Analysis beginning on page | FOR | ||||
ITEM 3 - Appointment of PricewaterhouseCoopers LLP as | |||||
| The Audit Committee of the Board and the Board believe that the retention of PricewaterhouseCoopers LLP to serve as the Independent Auditors for the fiscal year ending December 31, | FOR | ||||
ITEM 4 | |||||
| The Board and management believe that the named Designated Company Director nominees possess the necessary qualifications and | FOR | ||||
| 6 | |||||||
| DIRECTOR NOMINEES | See page | ||||
| Committee Membership (1) | ||||||||||
| Name | Age | Director Since | Primary Occupation | UW | A | C | E | FIR | N | |
| Eric W. Doppstadt | 58 | November 2010 | Vice President and Chief Investment Officer of the Ford Foundation | n | n | |||||
| Laurie S. Goodman | 62 | Nominee | Vice President of the Housing Finance Policy Center at the Urban Institute | |||||||
| Constantine Iordanou | (2) | 68 | January 2002 | Chairman of Arch Capital | n | n | ||||
| John M. Pasquesi | 58 | November 2001 | Managing Member of Otter Capital LLC | n | n | n | n | n | ||
| Committee Membership (1) | |||||||||||||||||||||||||||||
| Name | Age | Director Since | Primary Occupation | A | CHC | E | FIR | NG | UW | ||||||||||||||||||||
| 68 | May 2018 | Institute Fellow at the Urban Institute and Founder of its Housing Finance Policy Center | n | n | n | ||||||||||||||||||||||||
| John M. Pasquesi | 64 | October 2001 | Managing Member of Otter Capital LLC | n | n | n | |||||||||||||||||||||||
| SHAREHOLDER ENGAGEMENT | See page | ||||
| ||
| 7 | ||||||||
| KEY EXECUTIVE COMPENSATION POLICIES AND PRACTICES | See page43 | ||||
| What We Don’t Do | ||||||||||||||
| 2024 PROXY STATEMENT | | 8 | ||||||

| OUR BUSINESS | OUR OPERATIONS | OUR INVESTING | OUR PEOPLE | OUR COMMUNITIES | ||||||||||
We offer services and insurance coverages that support our clients through major loss and improve their resiliency; we integrate ESG factors into our underwriting to reduce risk and capture opportunities for stakeholder benefit. | We believe incorporating certain nonfinancial ESG factors into investment selection and risk management can potentially enhance long-term investment returns. | We are committed to | Striving to make a | |||||||||||
| 9 | | 2024 PROXY STATEMENT | | ||||||
| Our Business | Our Operations | Our Investing | Our People | Our Communities | |||||||||||||||||||||||||
| n | Strategic approach to enterprise risk management, including integration of climate risk. | n | Enhancing our data privacy and protection programs. | n | Implementing our Responsible Investing Policy. | n | Advancing our diversity and inclusion (“D&I”) efforts and cultivating a workplace environment with thoughtful collaboration and respect. | n | Corporate giving of $5.9 million to organizations that support our giving focus areas. | ||||||||||||||||||||
| Underwriting initiatives to improve resiliency and transition to a lower-carbon economy. | n | Conducting business ethically. | n | Continuing to focus on ESG factors in decision-making and including responsible investments in our portfolio. | n | Supporting a culture of lifelong learning, emphasizing leadership development and maintaining operational excellence. | n | The Arch Group Foundation reflects our belief in the transformative power of giving; granting $1.1 million in 2023. | |||||||||||||||||||||
| n | Underwriting socially sustainable insurance products. | n | Measuring and committing to mitigate our Scope 1 and 2 greenhouse gas emissions in line with our 2030 goal for net zero. | n | Aligning with asset managers who are UN PRI signatories, supporting our commitment to considering ESG risks and opportunities in investment decisions. | n | Protecting our employees’ health and well-being. | n | Promoting a culture of community engagement, we continue to support regional volunteerism through our volunteer time-off program. | ||||||||||||||||||||
| 2024 PROXY STATEMENT | | 10 | ||||||
Our website— | |||||||||||||||||
Proxy website— |
| 11 | ||||||||
| | |||||||
| ||
| ||
 | |
| ||
| ||
| ||
| ||
| ||
| ||
| ||
| 2024 PROXY STATEMENT | | 12 | ||||||
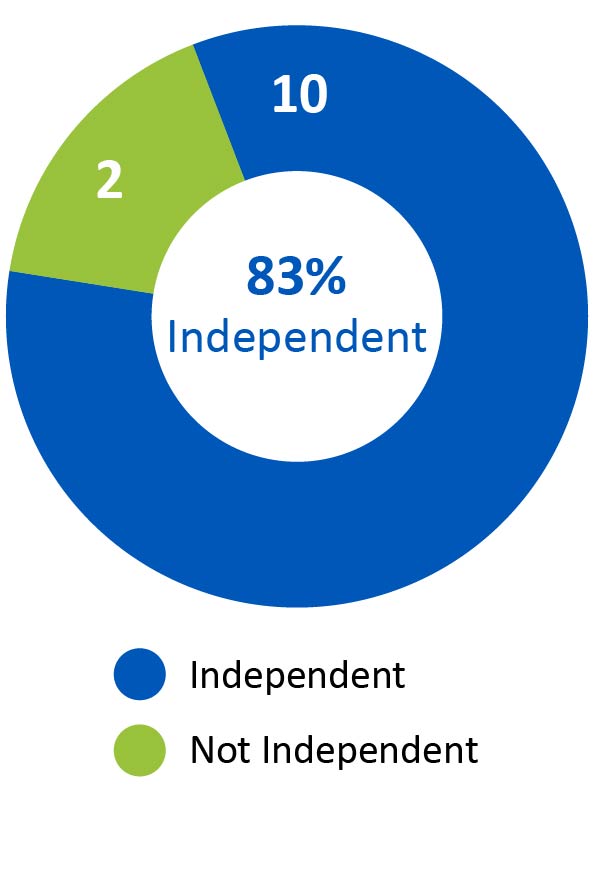
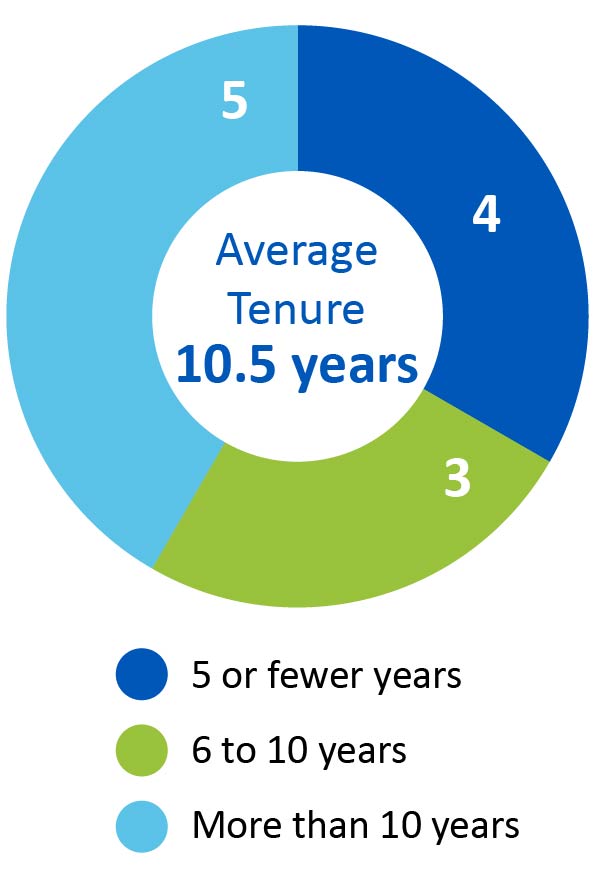
| Independence | Tenure | Age | ||||||||||||
 |  |  | ||||||||||||
Board Diversity Matrix (as of March 28, 2024) | |||||||||||||||||
Total Number of Directors: 12 | |||||||||||||||||
| Female | Male | Non-Binary | Did Not Disclose Gender | ||||||||||||||
| Part I: Gender Identity | |||||||||||||||||
| Directors | 3 | 8 | 0 | 1 | |||||||||||||
| Part II: Demographic Background | |||||||||||||||||
| African American or Black | 0 | 1 | 0 | 0 | |||||||||||||
| Alaskan Native or Native American | 0 | 0 | 0 | 0 | |||||||||||||
| Asian | 0 | 0 | 0 | 0 | |||||||||||||
| Hispanic or Latinx | 0 | 0 | 0 | 0 | |||||||||||||
| Native Hawaiian or Pacific Islander | 0 | 0 | 0 | 0 | |||||||||||||
| White | 3 | 6 | 0 | 0 | |||||||||||||
| Two or More Races or Ethnicities | 0 | 0 | 0 | 0 | |||||||||||||
| LGBTQ+ | 0 | ||||||||||||||||
| Did Not Disclose Demographic Background | 2 | ||||||||||||||||
| 13 | | 2024 PROXY STATEMENT | | ||||||
| ||
| Audit Committee | Oversees management of financial reporting, compliance and operational risks. | ||||
| Compensation and Human Capital Committee | Oversees the management of risks relating to the Company’s compensation plans and arrangements, retention of personnel and succession planning with regard to members of our executive management team. | ||||
| Executive Committee | Oversees and directs the business and affairs of the Company in intervals between meetings of the Board. | ||||
| Finance, Investment and Risk Committee | Oversees risks relating to the financial, investment and other risk affairs of the Company. | ||||
| Nominating and Governance Committee | Oversees risks associated with the composition of the Board, corporate governance, ESG matters and succession planning relating to our CEO. | ||||
| Underwriting Oversight Committee | Oversees risks relating to our underwriting activities, including with respect to accumulations and aggregations of exposures in our insurance, reinsurance and mortgage businesses. | ||||
| ||||||||
| 15 | ||||||||
| | | | |||||||
| Director | Audit | Compensation and Human Capital | Executive | ||||||||||||||||||||||||||||||||||||||||||||
| Finance, Investment and Risk | Nominating and Governance | Underwriting Oversight | |||||||||||||||||||||||||||||||||||||||||||||
| John L. Bunce, Jr. | n | n | |||||||||||||||||||||||||||||||||||||||||||||
| Eric W. Doppstadt | n | n | n | ||||||||||||||||||||||||||||||||||||||||||||
| Francis Ebong | n | n | |||||||||||||||||||||||||||||||||||||||||||||
| n | n | n | |||||||||||||||||||||||||||||||||||||||||||||
| n | |||||||||||||||||||||||||||||||||||||||||||||||
| Moira Kilcoyne | n | Chair | |||||||||||||||||||||||||||||||||||||||||||||
| n | |||||||||||||||||||||||||||||||||||||||||||||||
| Louis J. Paglia | n | Chair | |||||||||||||||||||||||||||||||||||||||||||||
| John M. Pasquesi | Chair | n | n | ||||||||||||||||||||||||||||||||||||||||||||
| Brian S. Posner | n | Chair | |||||||||||||||||||||||||||||||||||||||||||||
| Eugene S. Sunshine | n | n | n | ||||||||||||||||||||||||||||||||||||||||||||
| John D. Vollaro | n | n | |||||||||||||||||||||||||||||||||||||||||||||
| 2024 PROXY STATEMENT | | 16 | ||||||
| ||
| 17 | | 2024 PROXY STATEMENT | | ||||||
| Laurie S. Goodman | ||||||||
| n | 68 years old | Ms. Goodman is an institute fellow at the Urban Institute and Founder of its Housing Finance Policy Center. Before joining the Urban Institute in 2013, Ms. Goodman spent 30 years at several Wall Street firms. From 2008 to 2013, she was Senior Managing Director at Amherst Securities Group, LP. From 1993 to 2008, Ms. Goodman was head of global fixed income research and Manager of U.S. securitized products research at UBS and predecessor firms. Before that, she was a senior fixed income analyst, a mortgage portfolio manager and a senior economist at the Federal Reserve Bank of New York. Ms. Goodman serves on the board of directors of a real estate investment trust, MFA Financial, and is an adviser to The Amherst Group, LLC. She previously served on the board of directors of Home Point Capital Inc. and was a member of the Federal Reserve Bank of New York’s Financial Advisory Roundtable, the Bipartisan Policy Center’s Housing Commission, Fannie Mae’s Affordable Housing Advisory Council as well as the Consumer Financial Protection Bureau’s Consumer Advisory Board. Ms. Goodman has a B.A. in Mathematics from the University of Pennsylvania and an A.M. and Ph.D. in Economics from Stanford University. Ms. Goodman’s qualifications for service on our Board include her extensive analytics and strategy experience, her housing finance expertise and her service on boards of directors of other companies. | ||||||
| n | Director since May 2018 | |||||||
| n | Class II Director of Arch Capital | |||||||
| n | Audit Committee | |||||||
| n | Nominating and Governance Committee | |||||||
| n | Underwriting Oversight Committee | |||||||
| John M. Pasquesi | ||||||||
| n | 64 years old | Mr. Pasquesi has been Chair of the Board of Arch Capital since September 2019 and a director of Arch Capital since October 2001. From November 2017 to September 2019, he was Lead Director. Mr. Pasquesi is the Managing Member of Otter Capital LLC, a private equity investment firm he founded in January 2001. He holds an A.B. from Dartmouth College and an M.B.A. from Stanford Graduate School of Business. Mr. Pasquesi’s qualifications for service on our Board include his investment skills, extensive experience in evaluating and overseeing companies in a wide range of industries, including the insurance industry, and service on boards of directors of other companies. | ||||||
| n | Director since October 2001 | |||||||
| n | Class II Director of Arch Capital | |||||||
| n | Executive Committee | |||||||
| n | Finance, Investment and Risk Committee | |||||||
| n | Underwriting Oversight Committee | |||||||
 | THE BOARD UNANIMOUSLY RECOMMENDS THAT YOU VOTE “FOR” THIS PROPOSAL. | ||||
| 2024 PROXY STATEMENT | | 18 | ||||||
| John L. Bunce, Jr. | ||||||||
| n | 65 years old | Mr. Bunce is a Managing Director and Founder of Greyhawk Capital Management, LLC and Managing Director and Founder of Steel Box, LLC. Both Greyhawk and Steel Box are investment organizations. Mr. Bunce has served as a director of numerous public and private companies and he continues to serve on several private company boards and as an Overseer of the Hoover Institution. He holds an A.B. from Stanford University and an M.B.A. from Harvard Business School. Mr. Bunce’s qualifications for service on our Board include his corporate finance background, investment skills, extensive experience in evaluating and overseeing companies in a wide range of industries and service on boards of directors of other companies. | ||||||
| n | Director since November 2001 | |||||||
| n | Class III Director of Arch Capital | |||||||
| n | Term expires 2025 | |||||||
| n | Executive Committee | |||||||
| n | Finance, Investment and Risk Committee | |||||||
| n | Nominating and Governance Committee | |||||||
| Francis Ebong | ||||||||
| n | 43 years old | Mr. Ebong is a Managing Director, Turtle Capital, LLC. He most recently served as Managing Director, Program Management at X, Alphabet’s in-house research and development division, where he was tasked with launching technologies to improve the lives of billions of people. He has an extensive background in technology and innovation, including serving as the Director of Global Operations and Partnerships at Facebook from 2015 to 2017, where he led a global team responsible for launches including FB Live, Marketplace and Messenger. Prior to Facebook, Mr. Ebong was the Head of Operations at Postmates and has experience working at Apple and Deloitte. Mr. Ebong is a veteran of the U.S. Navy and has a degree from the U.S. Naval Academy and an M.B.A. from the George Washington School of Business. Mr. Ebong’s qualifications for service on our Board include his extensive operational experience and his technology management skills. | ||||||
| n | Director since August 2021 | |||||||
| n | Class I Director of Arch Capital | |||||||
| n | Term expires 2026 | |||||||
| n | Audit Committee | |||||||
| n | Compensation and Human Capital Committee | |||||||
| n | Nominating and Governance Committee | |||||||
| Marc Grandisson | ||||||||
| n | 56 years old | Mr. Grandisson is the Chief Executive Officer of Arch Capital as well as a member of our Board, both positions he has served in since March 2018. From March 2018 to December 2020, he was also President of Arch Capital, and from January 2016 to March 2018, he was President and Chief Operating Officer of Arch Capital. Prior to that role, he was Chairman and Chief Executive Officer of Arch Worldwide Reinsurance Group from 2005 to 2015 and the Chairman and Chief Executive Officer of Arch Worldwide Mortgage Group from February 2014 to December 2015. He joined Arch Reinsurance Ltd. (“Arch Re Bermuda”) in October 2001 as Chief Actuary. He subsequently held various leadership roles, including Chief Underwriting Officer and Actuary, President and Chief Operating Officer, eventually being named President and Chief Executive Officer at Arch Re Bermuda. Prior to joining Arch, he held various positions with the Berkshire Hathaway Group, F&G Re, Inc. and Tillinghast/Towers Perrin. He holds a B.Sc. in Actuarial Science from Université Laval in Canada and an M.B.A. from The Wharton School of the University of Pennsylvania. He is a Fellow of the Casualty Actuarial Society and a Member of the American Academy of Actuaries. Mr. Grandisson’s qualifications for service on our Board include his financial background, extensive executive management and operating experience in the insurance industry and his in-depth knowledge of our operations. | ||||||
| n | With Arch since October 2001 | |||||||
| n | Chief Executive Officer of Arch Capital | |||||||
| n | Director since March 2018 | |||||||
| n | Class III Director of Arch Capital | |||||||
| n | Term expires 2025 | |||||||
| n | Executive Committee | |||||||
| 19 | | 2024 PROXY STATEMENT | | ||||||
| Moira Kilcoyne | ||||||||
| n | 62 years old | Ms. Kilcoyne is a technology industry veteran with extensive financial services experience. From 2013 to 2016, she served as Managing Director, Co-Chief Information Officer of Morgan Stanley where she co-headed the company’s global technology and data business and she also sat on the firm’s Management Committee. Prior to becoming Managing Director, Co-Chief Information Officer, Ms. Kilcoyne held a number of senior technology roles within Morgan Stanley. She currently serves on the board of directors of Quilter plc and is a member of the Board of Governors of FINRA. Prior board roles have included Citrix Systems, Inc. and as a Trustee of Manhattan College. Ms. Kilcoyne has a B.S. in Mathematics from Manhattan College. Ms. Kilcoyne’s qualifications for service on our Board include her more than 30 years of experience in the technology industry, her extensive financial services experience and service on boards of directors of other companies. | ||||||
| n | Director since January 2020 | |||||||
| n | Class III Director of Arch Capital | |||||||
| n | Term expires 2025 | |||||||
| n | Audit Committee | |||||||
| n | Compensation and Human Capital Committee | |||||||
| n | Nominating and Governance Committee | |||||||
| Eileen Mallesch | ||||||||
| n | 68 years old | Ms. Mallesch has more than 30 years of finance and risk experience, including serving as Senior Vice President and Chief Financial Officer for Nationwide’s Property and Casualty segment from 2005 to 2009. Prior to that, she was Chief Financial Officer, Senior Vice President at Genworth (2003 to 2005) and General Electric’s (2000 to 2003) Group Insurance and Life Insurance businesses. Ms. Mallesch has broad finance and business strategy expertise in the insurance, telecommunications and consumer products industries. Her significant board experience includes current positions on the boards of Brighthouse Financial and Fifth Third Bancorp. She previously served on the boards of Bob Evans, Libbey Inc., and State Auto Financial. Ms. Mallesch has a B.S. in Accounting from the City University of New York and is a CPA. Ms. Mallesch’s qualifications for service on our Board include her extensive senior management and operating experience in the insurance industry and her service on boards of directors of other companies. | ||||||
| n | Director since August 2021 | |||||||
| n | Class I Director of Arch Capital | |||||||
| n | Term expires 2026 | |||||||
| n | Audit Committee | |||||||
| n | Underwriting Oversight Committee | |||||||
| Brian S. Posner | ||||||||
| n | 62 years old | Mr. Posner has been a private investor since March 2008 and is the President of Point Rider Group LLC and Point Rider Group (UK) Ltd., both being consulting and advisory services firms focused on financial, technology, bio-pharmaceutical and other services-related companies. From 2005 to March 2008, Mr. Posner served as the President, Chief Executive Officer and Co-Chief Investment Officer of ClearBridge Advisors, LLC, an asset management company and a wholly owned subsidiary of Legg Mason (since acquired by Franklin Resources). Prior to that, in 2000, Mr. Posner co-founded Hygrove Partners LLC, a private investment fund and served as the Managing Member for five years. He served as a portfolio manager and an analyst at Fidelity Investments from 1987 to 1996 and, from 1997 to 1999, at Warburg Pincus Asset Management/Credit Suisse Asset Management where he also served as Co-Chief Investment Officer and director of research. Mr. Posner is a Charter Trustee of Northwestern University and serves on the Advisory Board at Northwestern’s Center for the Study of Diversity and Democracy. He previously served on the board of directors of Biogen Inc. and as Chair of the AQR Funds, among others. He holds a B.A. from Northwestern University and an M.B.A. from the University of Chicago Booth School of Business. Mr. Posner’s qualifications for service on our Board include his strong financial background, investment skills and extensive experience as a leading institutional investment manager and advisor, as well as his general expertise in matters pertaining to the financial services industry. | ||||||
| n | Director since November 2010 | |||||||
| n | Class I Director of Arch Capital | |||||||
| n | Term expires 2026 | |||||||
| n | Compensation and Human Capital Committee | |||||||
| n | Finance, Investment and Risk Committee | |||||||
| 2024 PROXY STATEMENT | | 20 | ||||||
| Eugene S. Sunshine | ||||||||
| n | 74 years old | Mr. Sunshine retired at the end of August 2014 as the Senior Vice President for Business and Finance at Northwestern University, the university’s chief financial and administrative officer. Before joining Northwestern in 1997, he was Senior Vice President for Administration at The Johns Hopkins University. Prior to Johns Hopkins, Mr. Sunshine held positions as New York State Deputy Commissioner for Tax Policy and New York State Treasurer as well as Director of Energy Conservation for the New York State Energy Office. Mr. Sunshine is a former member of the boards of Chicago Board Options Exchange, Kaufman Hall and Associates, Keypath Education, Bloomberg L.P., National Mentors Holdings, Nuveen Investments and Kaufman Hall & Associates. He holds a B.A. from Northwestern University and a Master of Public Administration degree from Syracuse University’s School of Citizenship and Public Affairs. Mr. Sunshine’s qualifications for service on our Board include his strong financial background and extensive executive management and operating experience. | ||||||
| n | Director since July 2014 | |||||||
| n | Class III Director of Arch Capital | |||||||
| n | Term expires 2025 | |||||||
| n | Audit Committee | |||||||
| n | Compensation and Human Capital Committee | |||||||
| n | Nominating and Governance Committee | |||||||
| John D. Vollaro | ||||||||
| n | 79 years old | Mr. Vollaro has been a Senior Advisor of Arch Capital since April 2009 and has served as a director of Arch Capital since November 2009. He was Executive Vice President and Chief Financial Officer of Arch Capital from January 2002 to March 2009 and Treasurer of Arch Capital from May 2002 to March 2009. Prior to joining us, Mr. Vollaro acted as an independent consultant in the insurance industry since March 2000. Prior to March 2000, Mr. Vollaro was President and Chief Operating Officer of W.R. Berkley Corporation from January 1996 and a director from September 1995 until March 2000. Mr. Vollaro was Chief Executive Officer of Signet Star Holdings, Inc., a joint venture between W.R. Berkley Corporation and General Re Corporation, from July 1993 to December 1995. Mr. Vollaro served as Executive Vice President of W.R. Berkley Corporation from 1991 until 1993, Chief Financial Officer and Treasurer of W.R. Berkley Corporation from 1983 to 1993 and Senior Vice President of W.R. Berkley Corporation from 1983 to 1991. Mr. Vollaro’s qualifications for service on our Board include his strong financial background, extensive executive management and operating experience in the insurance industry and his in-depth knowledge of our operations. | ||||||
| n | With Arch since 2002 | |||||||
| n | Director since November 2009 | |||||||
| n | Class I Director of Arch Capital | |||||||
| n | Term expires 2026 | |||||||
| n | Finance, Investment and Risk Committee | |||||||
| n | Underwriting Oversight Committee | |||||||
| 21 | | | | ||||||
| François Morin | ||||||||
| n | 56 years old | Mr. Morin is Executive Vice President, Chief Financial Officer and Treasurer of Arch Capital, a position he has held since May 2018. Prior to such position, Mr. Morin served as Senior Vice President, Chief Risk Officer and Chief Actuary of Arch Capital, a position he held since May 2015. He joined Arch Capital in October 2011 as Chief Actuary and Deputy Chief Risk Officer. From January 1990 through September 2011, Mr. Morin served in various roles for Towers Watson & Co. and its predecessor firm, Towers Perrin Forster & Crosby, including its actuarial division, Tillinghast. He holds a B.Sc. in Actuarial Science from Université Laval in Canada. He is a Fellow of the Casualty Actuarial Society, a Chartered Financial Analyst, a Chartered Enterprise Risk Analyst and a Member of the American Academy of Actuaries. | ||||||
| n | With Arch since October 2011 | |||||||
| n | Executive Vice President, Chief Financial Officer and Treasurer, Arch Capital | |||||||
| Nicolas Papadopoulo | ||||||||
| n | 61 years old | Mr. Papadopoulo is President and Chief Underwriting Officer of Arch Capital and CEO of Arch Worldwide Insurance Group, a position he has held since January 2021. From September 2017 to December 2020, Mr. Papadopoulo was Chairman and Chief Executive Officer of Arch Worldwide Insurance Group and Chief Underwriting Officer for Property and Casualty Operations. From July 2014 to September 2017, Mr. Papadopoulo was Chairman and Chief Executive Officer of Arch Reinsurance Group at Arch Capital. He joined Arch Re Bermuda in December 2001 where he held a variety of underwriting roles. Prior to joining Arch, he held various positions at Sorema N.A. Reinsurance Group, a U.S. subsidiary of Groupama and he was also an insurance examiner with the Ministry of Finance, Insurance Department, in France. Mr. Papadopoulo graduated from École Polytechnique in France and École Nationale de la Statistique et de l’Administration Economique in France with a master’s degree in statistics. He is also a Member of the International Actuarial Association and a Fellow at the French Actuarial Society. | ||||||
| n | With Arch since December 2001 | |||||||
| n | President and Chief Underwriting Officer, Arch Capital and CEO, Arch Worldwide Insurance Group | |||||||
| Maamoun Rajeh | ||||||||
| n | 53 years old | Mr. Rajeh has served as Chairman and Chief Executive Officer of Arch Worldwide Reinsurance Group since October 2017. From July 2014 to September 2017, he was Chairman and Chief Executive Officer of Arch Re Bermuda. He joined Arch Re Bermuda in 2001 as an underwriter, ultimately becoming Chief Underwriting Officer in November 2005. Most recently, he was President and Chief Executive Officer of Arch Reinsurance Europe Underwriting Designated Activity Company (“Arch Re Europe”) from October 2012 to July 2014. From 1999 to 2001, Mr. Rajeh served as Assistant Vice President at HartRe, a subsidiary of The Hartford Financial Services Group, Inc. Mr. Rajeh also served in several business analysis positions at the United States Fidelity and Guarantee Company between 1992 and 1996 and as an underwriter at F&G Re from 1996 to 1999. He has a B.S. from The Wharton School of Business of the University of Pennsylvania and he is a Chartered Property Casualty Underwriter. | ||||||
| n | With Arch since December 2001 | |||||||
| n | Chairman and Chief Executive Officer, Arch Worldwide Reinsurance Group | |||||||
| 2024 PROXY STATEMENT | | 22 | ||||||
| David E. Gansberg | ||||||||
| n | 51 years old | Mr. Gansberg was named Chief Executive Officer of Arch Capital’s Global Mortgage Group on March 1, 2019. From February 2013 through February 2019, he was the President and Chief Executive Officer of Arch Mortgage Insurance Company. From July 2007 to February 2013, Mr. Gansberg was Executive Vice President and a director at Arch Re (U.S.). Prior to that, he held various underwriting, operational and strategic roles at Arch Re Bermuda and Arch Capital Services LLC, where he joined in December 2001. Prior to joining Arch, Mr. Gansberg held various positions with ACE Bermuda and Cigna Property and Casualty. He holds a B.S. in Actuarial Mathematics from the University of Michigan. | ||||||
| n | With Arch since December 2001 | |||||||
| n | Chief Executive Officer, Global Mortgage Group, Arch Capital | |||||||
| Jennifer Centrone | ||||||||
| n | 51 years old | Ms. Centrone is the Executive Vice President, Chief Human Resources Officer of Arch Capital Services LLC, where she is responsible for leading the organization’s talent and culture strategies. Prior to joining Arch, Ms. Centrone was Senior Vice President, Human Resources at Voya Financial from August 2015 to May 2019, where she was responsible for leading key talent, organizational and transformational strategies. Before Voya Financial, Ms. Centrone held senior human resources roles at both The Hartford Financial Services Group, Inc. and Accenture. She holds a B.A. in English Writing and Literature from Fairfield University. | ||||||
| n | With Arch since June 2019 | |||||||
| n | Executive Vice President, Chief Human Resources Officer of Arch Capital Services LLC | |||||||
| Chris Hovey | ||||||||
| n | 57 years old | Mr. Hovey is Chief Operations Officer of Arch Capital Services LLC. From July 2018 to January 2020, Mr. Hovey served as Executive Vice President and Chief Information Officer at Arch Capital Services LLC. Prior to that, he held the role of Chief Operating Officer of Arch Mortgage Insurance Company. Before joining Arch, Mr. Hovey acted as Chief Operating Officer for PMI Mortgage Insurance Co. (“PMI”) since 2011. He also served as Senior Vice President of servicing operations and loss management for PMI, which he originally joined in 2002. Mr. Hovey holds a B.A. from San Francisco State University and an M.B.A. from Saint Mary’s College in Moraga, California. | ||||||
| n | With Arch since January 2014 | |||||||
| n | Chief Operations Officer of Arch Capital Services LLC | |||||||
| Louis T. Petrillo | ||||||||
| n | 58 years old | Mr. Petrillo has been President and General Counsel of Arch Capital Services LLC since April 2002. From May 2000 to April 2002, he was Senior Vice President, General Counsel and Secretary of Arch Capital. From 1996 until May 2000, Mr. Petrillo was Vice President and Associate General Counsel of Arch Capital’s reinsurance subsidiary. Prior to that time, Mr. Petrillo practiced law at the New York firm of Willkie Farr & Gallagher LLP. He holds a B.A. from Tufts University and a law degree from Columbia University. | ||||||
| n | With Arch since January 1996 | |||||||
| n | President and General Counsel of Arch Capital Services LLC | |||||||
| 23 | | 2024 PROXY STATEMENT | | ||||||
| Jay Rajendra | ||||||||
| n | 43 years old | Mr. Rajendra is the Chief Strategy and Innovation Officer at Arch Capital. He is responsible for pursuing new business models and technologies while leading Arch’s analytics capabilities to improve profitability and growth. Mr. Rajendra joined Arch in 2016 in the role of Chief Analytics Officer for Arch Capital, a position he held until January 2020. Prior to joining Arch, Mr. Rajendra was Head of Business Solutions for XL Catlin’s Strategic Analytics team. Before XL, Mr. Rajendra was a Senior Consultant at Towers Watson in both North America and Europe, where he advised large international (re)insurers and start-ups on pricing, strategy and mergers and acquisitions (“M&A”). He is a Fellow of the Institute of Actuaries, Fellow of the Casualty Actuarial Society and Member of the American Academy of Actuaries. He holds a combined Bachelors and Masters in Mathematics from Oxford University and an M.B.A. from Massachusetts Institute of Technology. | ||||||
| n | With Arch since August 2016 | |||||||
| n | Chief Strategy and Innovation Officer at Arch Capital | |||||||
| Christine Todd | ||||||||
| n | 57 years old | Ms. Todd is Senior Vice President, Chief Investment Officer at Arch Capital and President of Arch Investment Management Ltd. (“AIM”) and has responsibility for setting the firm’s investment strategy and managing the day-to-day operations of the investment portfolio. Prior to joining Arch, Ms. Todd was Head of Fixed Income, U.S., for Amundi US from February 2019 to May 2021. She has also held executive roles at Neighborly Investments; Standish Mellon Asset Management Company LLC; and Gannett, Welsh & Kotler. She is a Chartered Financial Analyst and holds a B.A. from Georgetown University and an M.B.A. from Boston University. | ||||||
| n | With Arch since June 2021 | |||||||
| n | Senior Vice President, Chief Investment Officer of Arch Capital | |||||||
| 2024 PROXY STATEMENT | | 24 | ||||||
| Name | Fees Earned or Paid in Cash ($)(1) | Stock Awards ($)(2) | Option Awards ($) | Non-Equity Incentive Plan Compensation ($) | Change in Pension Value and Non- qualified Deferred Compensation Earnings ($) | All Other Compensation ($)(3) | Total ($) | ||||||||||||||||
| John L. Bunce, Jr. | C | 158,528 | 74,933 | — | — | — | — | 233,461 | |||||||||||||||
| Eric W. Doppstadt | FC | 154,528 | 74,933 | — | — | — | 15,000 | 244,461 | |||||||||||||||
| Kewsong Lee | * | 157,528 | — | — | — | — | 50,000 | 207,528 | |||||||||||||||
| Yiorgos Lillikas | 173,528 | 74,933 | — | — | — | — | 248,461 | ||||||||||||||||
| Deanna Mulligan (4) | — | — | — | — | — | — | — | ||||||||||||||||
| Louis J. Paglia | 179,528 | 74,933 | — | — | — | 50,000 | 304,461 | ||||||||||||||||
| John M. Pasquesi | LD* | 174,028 | 74,933 | — | — | — | 50,000 | 298,961 | |||||||||||||||
| Brian S. Posner | AC | 204,528 | 74,933 | — | — | — | 50,000 | 329,461 | |||||||||||||||
| Eugene S. Sunshine | C | 184,528 | 74,933 | — | — | — | 20,900 | 280,361 | |||||||||||||||
| John D. Vollaro (5)(6) | C | 700,000 | — | — | — | — | 77,777 | 777,777 | |||||||||||||||
| (1) | Non-Employee Director Cash Compensation | Annual Cash Retainer | ||
| Non-Employee Director Retainer (A) | $ | 125,000 | ||
| Additional Retainers and Fees for Board Members, Committee Chairs, Committee Members (B) | ||||
| Meeting Fees | ||||
| Board | $ | 2,500 | ||
| Committee | $ | 1,500 | ||
| Audit Committee Chair | $ | 50,000 | ||
| Audit Committee Member | $ | 25,000 | ||
| Finance, Investment & Risk Committee Chair | $ | 15,000 | ||
| Committee Chair (other than above) | $ | 10,000 | ||
| ||
| Name | Committee Chair | Fees Earned or Paid in Cash ($)(1) | Stock Awards ($)(2) | All Other Compensation ($)(3) | Total ($) | ||||||||||||||||||||||||
| John L. Bunce, Jr. | NC | 150,007 | 124,985 | — | 274,992 | ||||||||||||||||||||||||
| Eric W. Doppstadt | 125,007 | 124,985 | — | 249,992 | |||||||||||||||||||||||||
| Francis Ebong | 154,596 | 124,985 | 24,618 | 304,199 | |||||||||||||||||||||||||
| Laurie S. Goodman | 150,007 | 124,985 | 25,000 | 299,992 | |||||||||||||||||||||||||
| Moira Kilcoyne | CC** | 154,596 | 124,985 | — | 279,581 | ||||||||||||||||||||||||
| Eileen Mallesch | AC | 179,596 | 124,985 | — | 304,581 | ||||||||||||||||||||||||
| Louis J. Paglia | UC | 175,007 | 124,985 | 25,000 | 324,992 | ||||||||||||||||||||||||
| John M. Pasquesi * | EC | 260,007 | 124,985 | 25,000 | 409,992 | ||||||||||||||||||||||||
| Brian S. Posner | FC | 175,007 | 124,985 | 2,500 | 302,492 | ||||||||||||||||||||||||
| Eugene S. Sunshine | 150,007 | 124,985 | 25,000 | 299,992 | |||||||||||||||||||||||||
| John D. Vollaro | 500,000 | (4) | — | 64,313 | (5) | 564,313 | |||||||||||||||||||||||
| Thomas R. Watjen | ** | 150,007 | 124,985 | — | 274,992 | ||||||||||||||||||||||||
| 25 | | 2024 PROXY STATEMENT | | ||||||
| Committee Chair/Member | Annual Fee ($) | ||||
| Audit Committee Chair | 50,000 | ||||
| Audit Committee Member | 25,000 | ||||
| Chair of the Board | 125,000 | ||||
| Compensation and Human Capital Committee Chair | 25,000 | ||||
| Executive Committee Chair | 10,000 | ||||
| Finance, Investment and Risk Committee Chair | 25,000 | ||||
| Nominating and Governance Committee Chair | 25,000 | ||||
| Underwriting Oversight Committee Chair | 50,000 | ||||
| 2024 PROXY STATEMENT | | 26 | ||||||
| ||
| ||
| 27 | | 2024 PROXY STATEMENT | | ||||||
| 2024 PROXY STATEMENT | | 28 | ||||||||
| Common Shares | |||||||||||
| Name and Address of Beneficial Owner | (A) Number of Common Shares Beneficially Owned (1) | (B) Rule 13d-3 Percentage Ownership (1) | |||||||||
| The Vanguard Group (2) 100 Vanguard Boulevard Malvern, Pennsylvania 19355 | 40,754,642 | 10.9 | % | ||||||||
| BlackRock, Inc. (3) 50 Hudson Yards New York, New York 10001 | 27,327,595 | 7.3 | % | ||||||||
| Artisan Partners Holdings LP (4) 875 East Wisconsin Avenue, Suite 800 Milwaukee, Wisconsin 53202 | 24,894,249 | 6.6 | % | ||||||||
| Baron Capital Group, Inc. (5) 767 Fifth Avenue New York, New York 10153 | 21,292,042 | 5.7 | % | ||||||||
| Marc Grandisson (6) | 3,926,104 | 1.0 | % | ||||||||
| John L. Bunce, Jr. (7) | 1,554,048 | * | |||||||||
| Eric W. Doppstadt (8) | 77,779 | * | |||||||||
| Francis Ebong (9) | 6,534 | * | |||||||||
| Laurie S. Goodman (10) | 32,483 | * | |||||||||
| Moira Kilcoyne (11) | 26,823 | * | |||||||||
| Eileen Mallesch (12) | 8,712 | * | |||||||||
| Louis J. Paglia (13) | 54,056 | * | |||||||||
| John M. Pasquesi (14) | 5,212,827 | 1.4 | % | ||||||||
| Brian S. Posner (15) | 117,085 | * | |||||||||
| Eugene S. Sunshine (16) | 33,075 | * | |||||||||
| John D. Vollaro (17) | 427,429 | * | |||||||||
| David E. Gansberg (18) | 502,946 | * | |||||||||
| François Morin (19) | 629,764 | * | |||||||||
| Nicolas Papadopoulo (20) | 1,244,614 | * | |||||||||
| Maamoun Rajeh (21) | 738,549 | * | |||||||||
| All directors and executive officers (18 persons) (22) | 15,079,006 | 4.0 | % | ||||||||
| Common Shares | ||||
| Name and Address of Beneficial Owner | (A) Number of Common Shares Beneficially Owned(1) | (B) Rule 13d-3 Percentage Ownership(1) | ||
| Artisan Partners Holdings LP (2) 875 East Wisconsin Avenue, Suite 800 Milwaukee, Wisconsin 53202 | 17,572,350 | 12.9 | % | |
| Cascade Investment, L.L.C. (3) 2365 Carillon Point Kirkland, Washington 98033 | 11,511,099 | 8.4 | % | |
| The Vanguard Group (4) 100 Vanguard Blvd. Malvern, Pennsylvania 19355 | 10,654,794 | 7.8 | % | |
| BlackRock Inc. (5) 55 East 52nd Street New York, New York 10022 | 8,897,534 | 6.5 | % | |
| Baron Capital Group, Inc. (6) 767 Fifth Avenue New York, New York 10153 | 8,433,758 | 6.2 | % | |
| Constantine Iordanou (7) | 2,422,476 | 1.7 | % | |
| Marc Grandisson (8) | 865,640 | * | ||
| John L. Bunce, Jr. (9) | 688,022 | * | ||
| Eric W. Doppstadt (10) | 15,904 | * | ||
| Yiorgos Lillikas (11) | 18,053 | * | ||
| Louis J. Paglia (12) | 7,191 | * | ||
| John M. Pasquesi (13) | 1,723,538 | 1.3 | % | |
| Brian S. Posner (14) | 22,439 | * | ||
| Eugene S. Sunshine (15) | 4,128 | * | ||
| John D. Vollaro (16) | 184,616 | * | ||
| Mark D. Lyons (17) | 171,660 | * | ||
| Nicolas Papadopolou (18) | 227,314 | * | ||
| Maamoun Rajeh (19) | 203,211 | * | ||
| Andrew T. Rippert (20) | 74,217 | * | ||
| All directors and executive officers (16 persons) (21) | 7,107,361 | 5.1 | % | |
| 29 | ||||||||
| | |||||||
(2)Based on a Schedule 13G/A filed with the SEC on February 13, 2024, by Vanguard. In the Schedule 13G/A it is reported that Vanguard has shared dispositive power with respect to 1,557,574 common shares, shared voting power with respect to 465,402 common shares and sole dispositive power with respect to 39,197,068 common shares. (3)Based on a Schedule 13G/A filed with the SEC on February 1, 2024, by BlackRock. In the Schedule 13G/A it is reported that BlackRock has sole voting power with respect to 24,554,161 common shares and sole dispositive power with respect to 27,327,595 common shares. (4)Based on a Schedule 13G/A filed with the SEC on February 12, 2024, jointly by APLP, Artisan Investments GP LLC (“Artisan Investments”), Artisan Partners Holdings LP (“Artisan Holdings”), Artisan Partners Asset Management Inc. (“APAM”) and Artisan Partners Funds, Inc. (“Artisan Funds”). APLP is an investment advisor and Artisan Funds is an investment company. Artisan Holdings is the sole limited partner of APLP and the sole member of Artisan Investments. Artisan Investments is the general partner of APLP and APAM is the general partner of Artisan Holdings. The Schedule 13G/A reported that the common shares have been acquired on behalf of discretionary clients of APLP, which holds 24,894,249 common shares, including 17,459,639 common shares on behalf of Artisan Funds. In addition, the Schedule 13G/A reported that (a) APLP, Artisan Investments, Artisan Holdings and APAM each has shared voting with respect to 24,097,765 common shares and shared dispositive power with respect to 24,894,249 common shares; and (b) Artisan Funds has shared voting and dispositive power with respect to 17,459,639 common shares. (5)Based upon a Schedule 13G/A filed with the SEC on February 14, 2024, jointly by Baron Capital Group, Inc. (“BCG”), BAMCO, Inc. (“BAMCO”), Baron Capital Management, Inc. (“BCM”) and Ronald Baron (collectively, the “Baron Group”). In the Schedule 13G/A, the Baron Group reported that BAMCO and BCM are subsidiaries of BCG, and Ronald Baron owns a controlling interest in BCG. In addition, the Schedule 13G/A reported that (a) BCG has shared voting power with respect to 20,905,042 common shares and shared dispositive power with respect to 21,292,042 common shares; (b) BAMCO has shared voting power with respect to 19,701,673 common shares and shared dispositive power with respect to 20,088,673 common shares; (c) BCM has shared voting and shared dispositive power with respect to 1,203,369 common shares; and (d) Ronald Baron has shared voting power with respect to 20,905,042 common shares and shared dispositive power with respect to 21,292,042 common shares. (6)Amounts in columns (A) and (B) reflect, on March 13, 2024, (a) 275,784 common shares owned directly by Mr. Grandisson (including 36,572 restricted shares, which were subject to vesting based solely on continued employment); (b) 1,937,157 common shares owned |
| ||
| 2024 PROXY STATEMENT | | 30 | ||||||
| 31 | | 2024 PROXY STATEMENT | | ||||||
| Preferred Shares | ||||||
| Name of Beneficial Owner | Number of Series E Preferred Shares Beneficially Owned | Percentage of Class Owned | Number of Series F Preferred Shares Beneficially Owned | Percentage of Class Owned | ||
| Constantine Iordanou (1) | * | * | 10,000 | * | ||
| Brian S. Posner | 6,000 | * | _ | * | ||
| All directors and executive officers (16 persons) | 6,000 | * | 10,000 | * | ||
| Preferred Shares | ||||||||
Percentage of Class Owned | ||||||||
| Brian S. Posner | 3,000 | * | ||||||
| * | |||||||
| Number of Series G Preferred Shares Beneficially Owned | Percentage of Class Owned | |||||||
| Brian S. Posner | 4,000 | * | ||||||
| All directors and executive officers (18 persons) | 4,000 | * | ||||||
| Common Shares | Preferred Shares | |||||||
| Name of Beneficial Owner | (A) Number of Watford Common Shares Beneficially Owned(1) | (B) Rule 13d-3 Percentage Owned | (C) Number of Watford Preferred Shares Beneficially Owned(2) | (D) Percentage of Class Owned | ||||
| Constantine Iordanou | 50,000 | * | 120,000 | 1.3 | % | |||
| Marc Grandisson | 125,000 | * | — | * | ||||
| John M. Pasquesi | 125,000 | * | — | * | ||||
| Nicolas Papadopoulo | 62,500 | * | — | * | ||||
| Maamoun Rajeh | 12,500 | * | — | * | ||||
| Mark D. Lyons | 6,250 | * | — | * | ||||
| Brian S. Posner | 6,250 | * | — | * | ||||
| All directors and executive officers (16 persons) | 393,750 | 2.0 | % | 130,000 | 1.4 | % | ||
| 2024 PROXY STATEMENT | | 32 | ||||||||
| THE BOARD UNANIMOUSLY RECOMMENDS THAT YOU VOTE “FOR” THIS PROPOSAL. | ||||
| Name | Title | ||||
| Marc Grandisson | |||||
| Executive Vice President, Chief Financial Officer and Treasurer, | |||||
| Nicolas Papadopoulo | President and Chief Underwriting Officer, Arch Capital and CEO, Arch Worldwide Insurance Group | ||||
| Maamoun Rajeh | Chairman and Chief Executive Officer, | ||||
| 33 | | 2024 PROXY STATEMENT | | ||||||
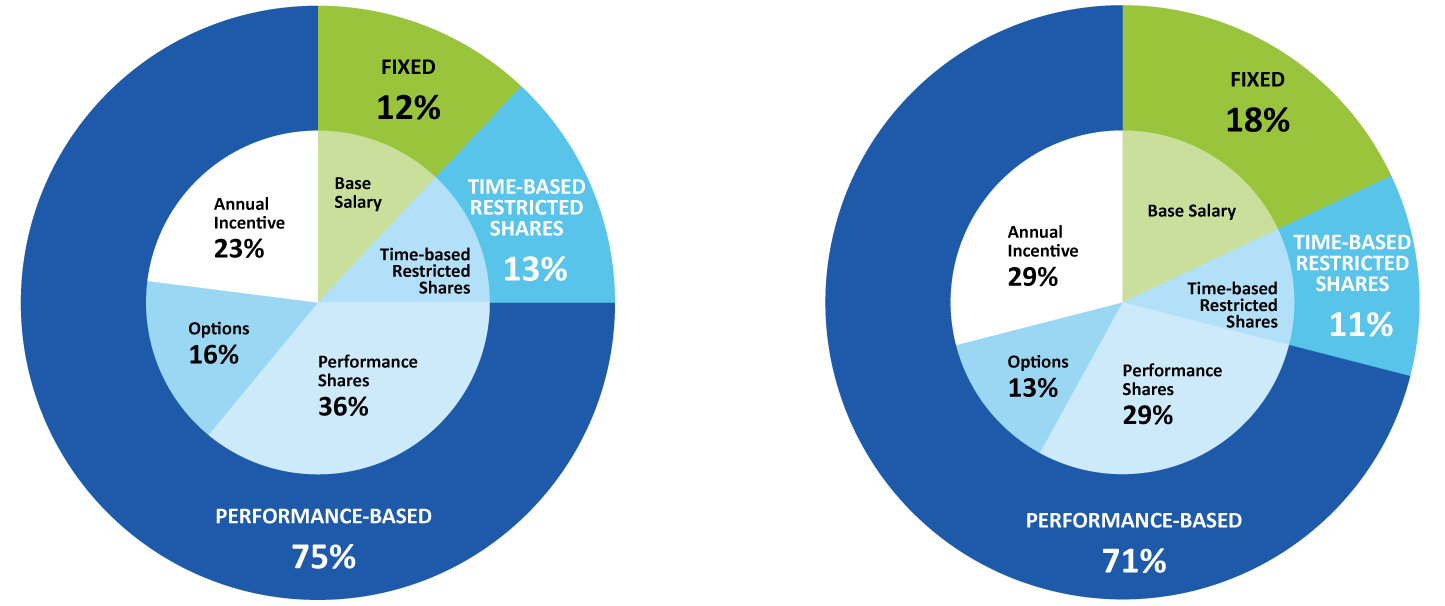
| CEO Target Mix of Pay | Other NEOs Target Mix of Pay | |||||||
| As illustrated above for our CEO, 75% of target compensation was performance-based and 65% consists of long-term incentives. | As illustrated above for our other NEOs, 71% of target compensation was performance-based and 53% consists of long-term incentives. | |||||||

| ||||||||
| (U.S. Dollars in millions, except share data) | Year Ended December 31, | |||||||
| 2017 | 2016 | Change | ||||||
| Book value per common share at year-end | $ | 60.91 | $ | 55.19 | 10.4 | % | ||
Tangible book value per common share at year-end 2 | $ | 56.19 | $ | 49.48 | 13.6 | % | ||
| Net income available to common shareholders | $ | 566.5 | $ | 664.7 | (14.8 | )% | ||
| Per share | $ | 4.07 | $ | 5.33 | (23.6 | )% | ||
| Net income return on average common equity | 7.2 | % | 10.9 | % | (3.7 | ) | ||
After-tax operating income available to Arch common shareholders 2 | $ | 447.2 | $ | 577.4 | (22.6 | )% | ||
| Per share | $ | 3.21 | $ | 4.63 | (30.7 | )% | ||
| Annualized return on average common equity | 7.2 | % | 10.9 | % | (3.7 | ) | ||
Annualized operating return on average common equity 2 | 5.7 | % | 9.4 | % | (3.7 | ) | ||
| Combined ratio | 88.8 | % | 87.6 | % | 1.2 | |||
| Gross premiums written | $ | 6,088 | $ | 5,019 | 21.3 | % | ||
| Net premiums written | $ | 4,408 | $ | 3,518 | 25.3 | % | ||
Underwriting income 2 | $ | 447.4 | $ | 447.1 | 0.1 | % | ||
| Net investment income | $ | 382 | $ | 277 | 37.8 | % | ||
| Per share | $ | 2.74 | $ | 2.22 | 23.4 | % | ||
| Weighted average common shares and common share equivalents outstanding | 139.3 | 124.7 | 11.7 | % | ||||
| ||
| 35 | | 2024 PROXY STATEMENT | |||||||||
| ||||||||||
| ||
| 2024 PROXY STATEMENT | | 36 | ||||||
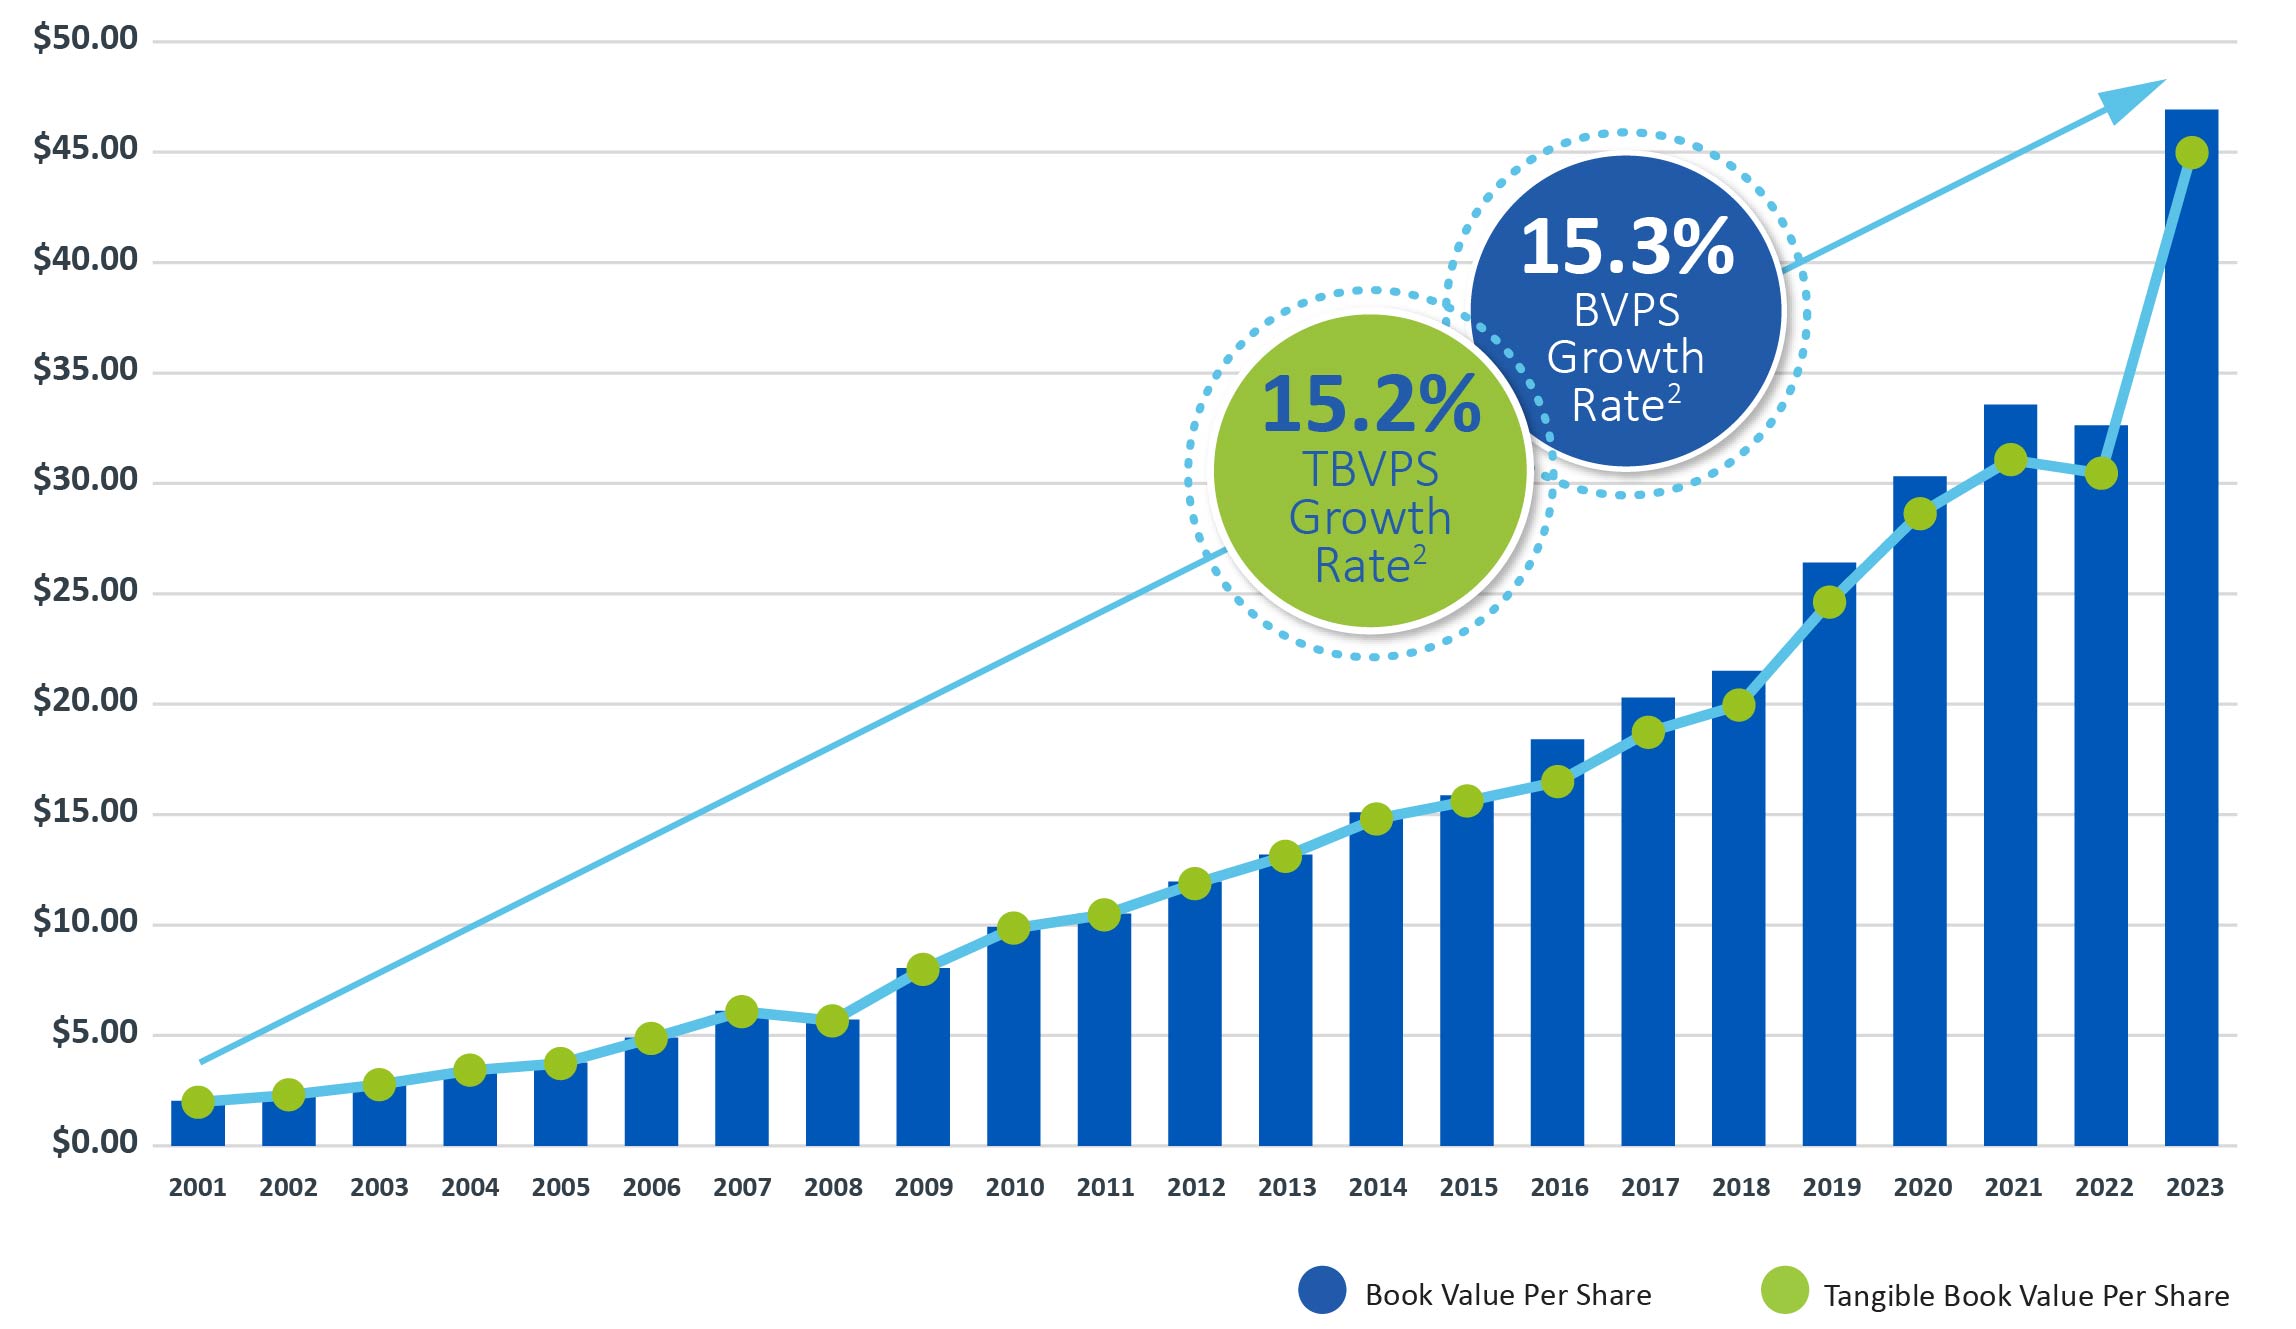
Growth in Book Value and Tangible Book Value1 per Common Share | ||||||||||||||
| 37 | | 2024 PROXY STATEMENT | | ||||||
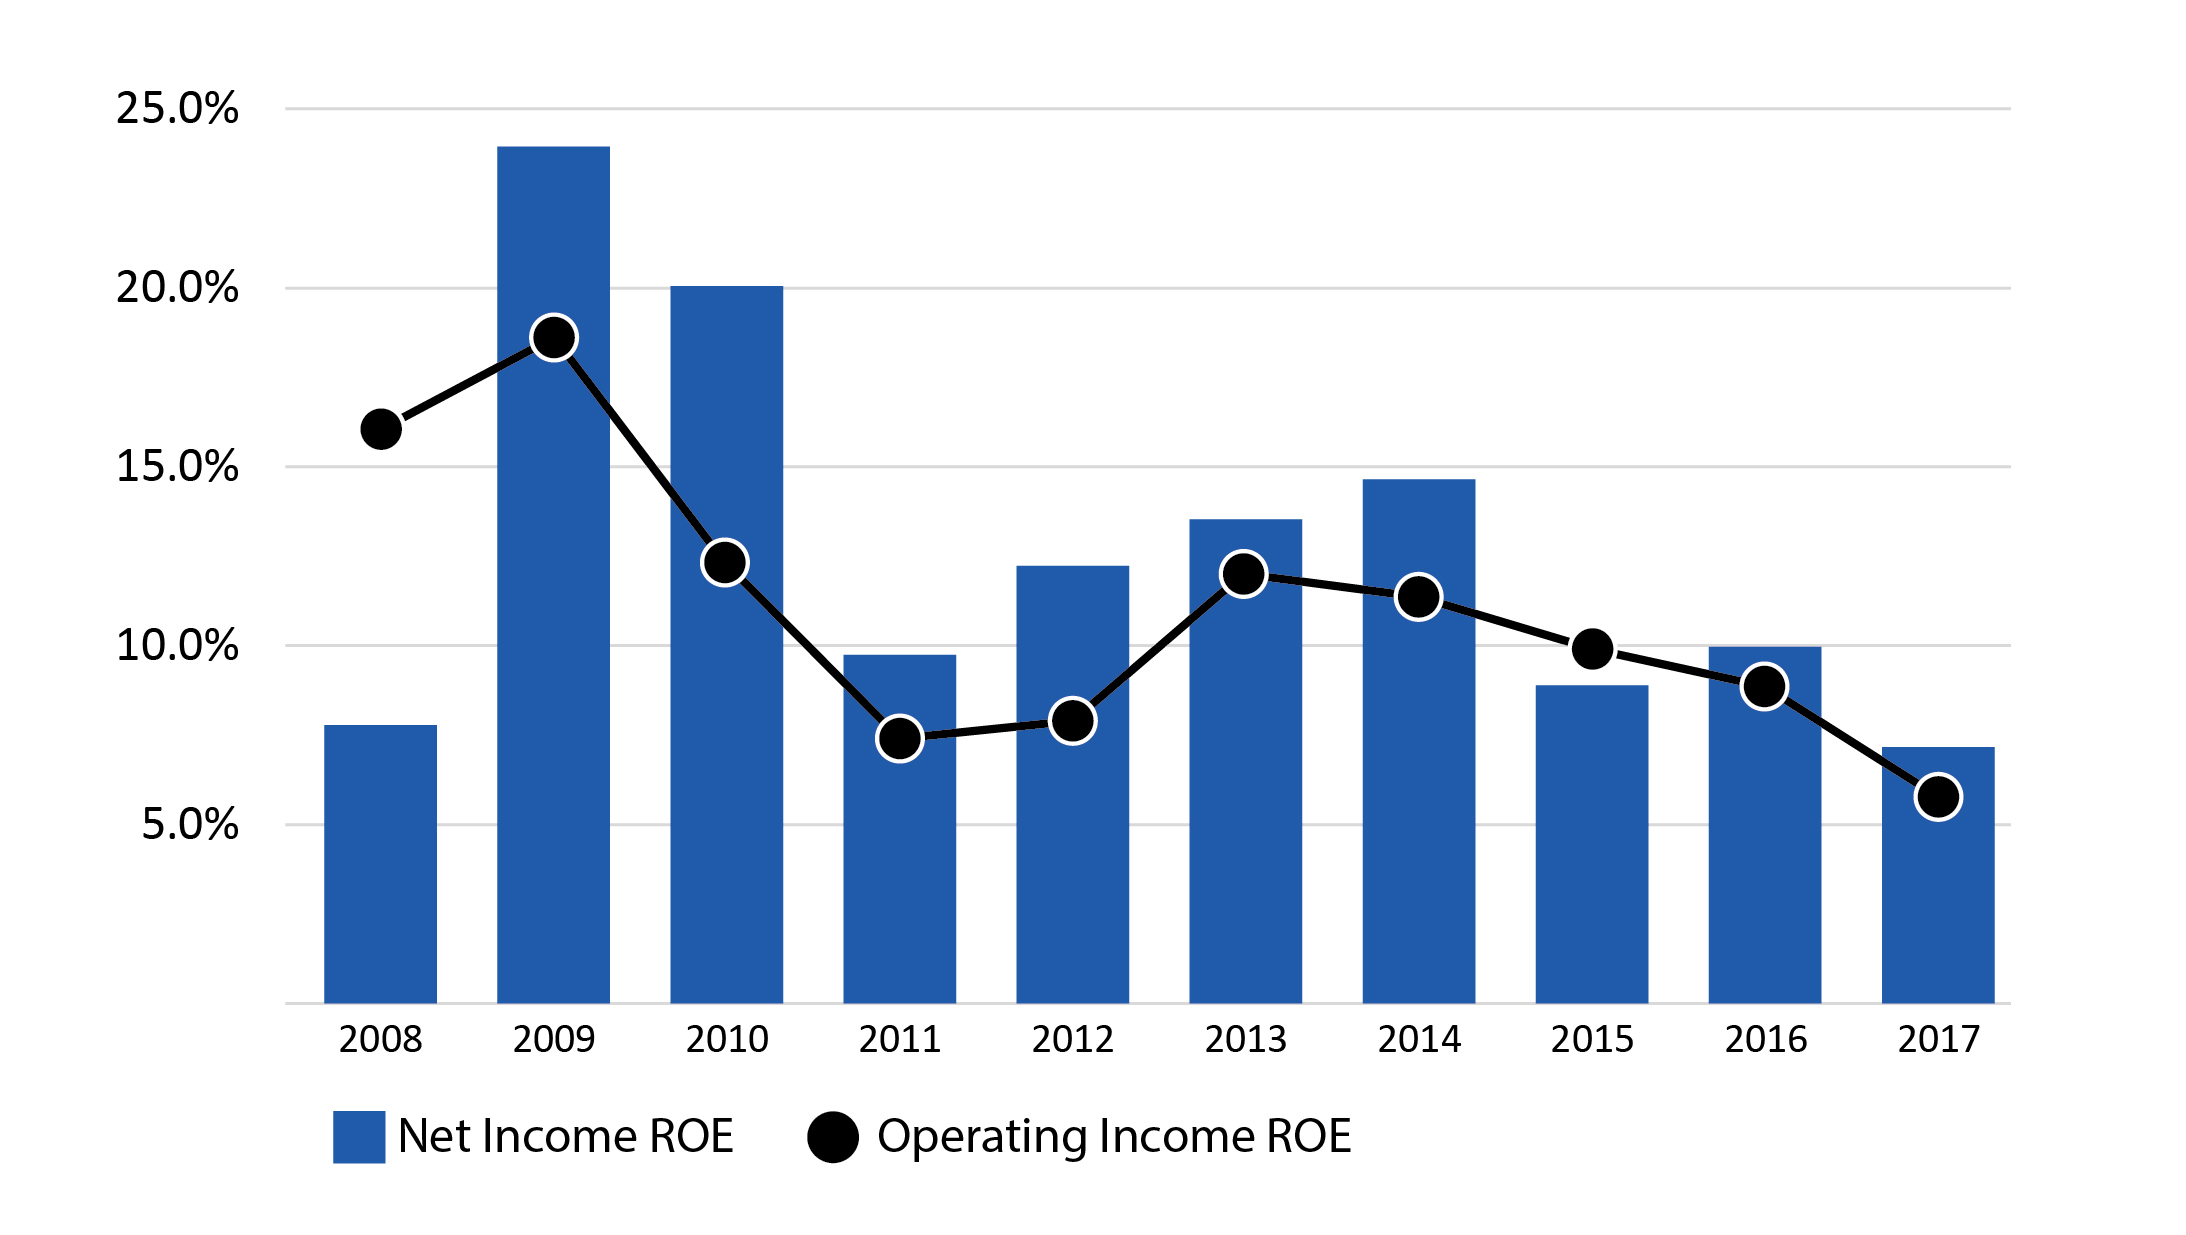
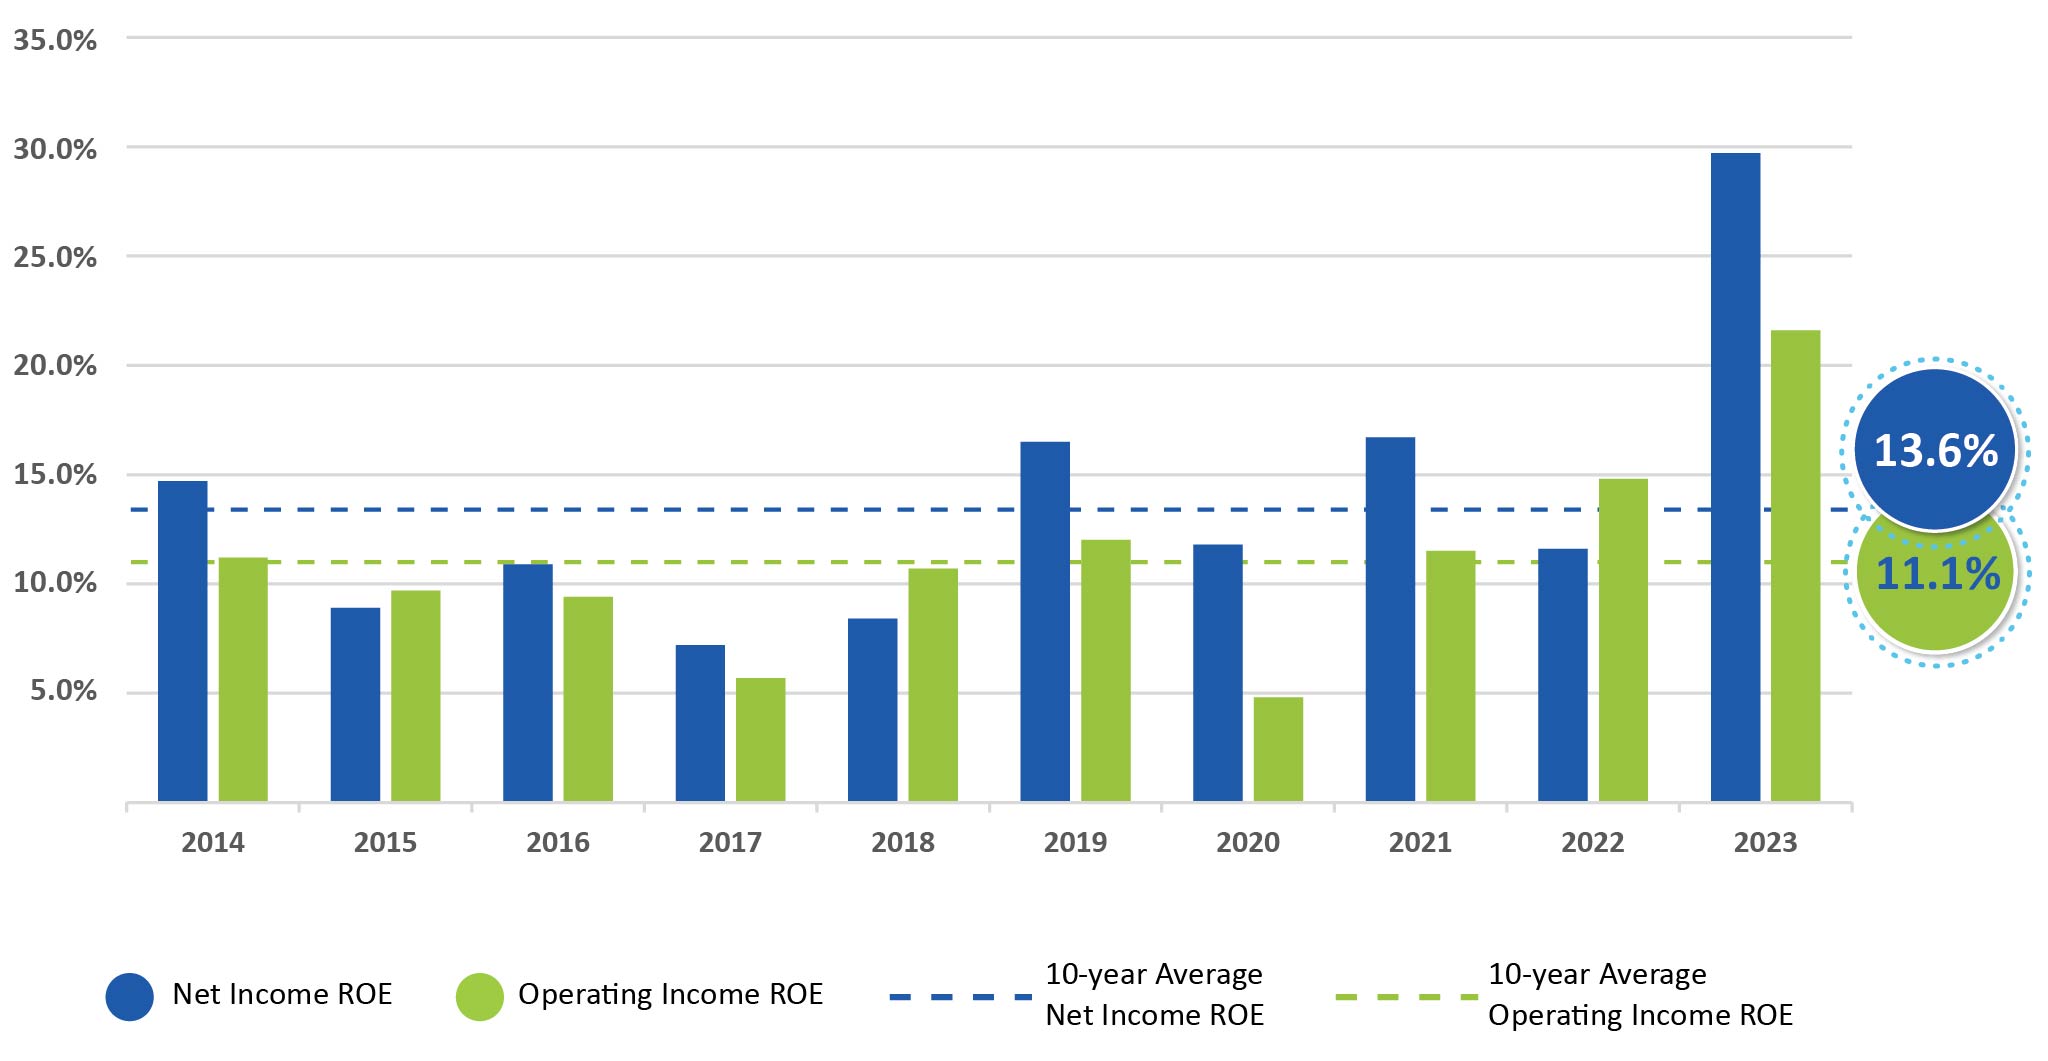
| Average Return on Equity (ROE) | ||||||||
| 1 Year | 3 Year | 5 Year | 10 Year | |||||
| Net Income ROE | 7.2 | % | 8.7 | % | 10.8 | % | 12.8 | % |
| Operating ROE | 5.7 | % | 8.0 | % | 9.4 | % | 10.8 | % |
Net Income ROE and Operating Income ROE1 | ||||||||||||||||||
| 2024 PROXY STATEMENT | | 38 | ||||||||
| December 31, | ||||||||
| 2017 | 2016 | Change | ||||||
| Senior notes/total capital available to Arch | 15.3 | % | 16.5 | % | (1.2 | ) | ||
| Revolving credit agreement borrowings/total capital available to Arch | 3.3 | % | 4.8 | % | (1.5 | ) | ||
| Debt/total capital available to Arch | 18.6 | % | 21.3 | % | (2.7 | ) | ||
| Preferred/total capital available to Arch | 7.7 | % | 7.4 | % | 0.3 | |||
| Debt and preferred/total capital available to Arch | 26.4 | % | 28.7 | % | (2.3 | ) | ||
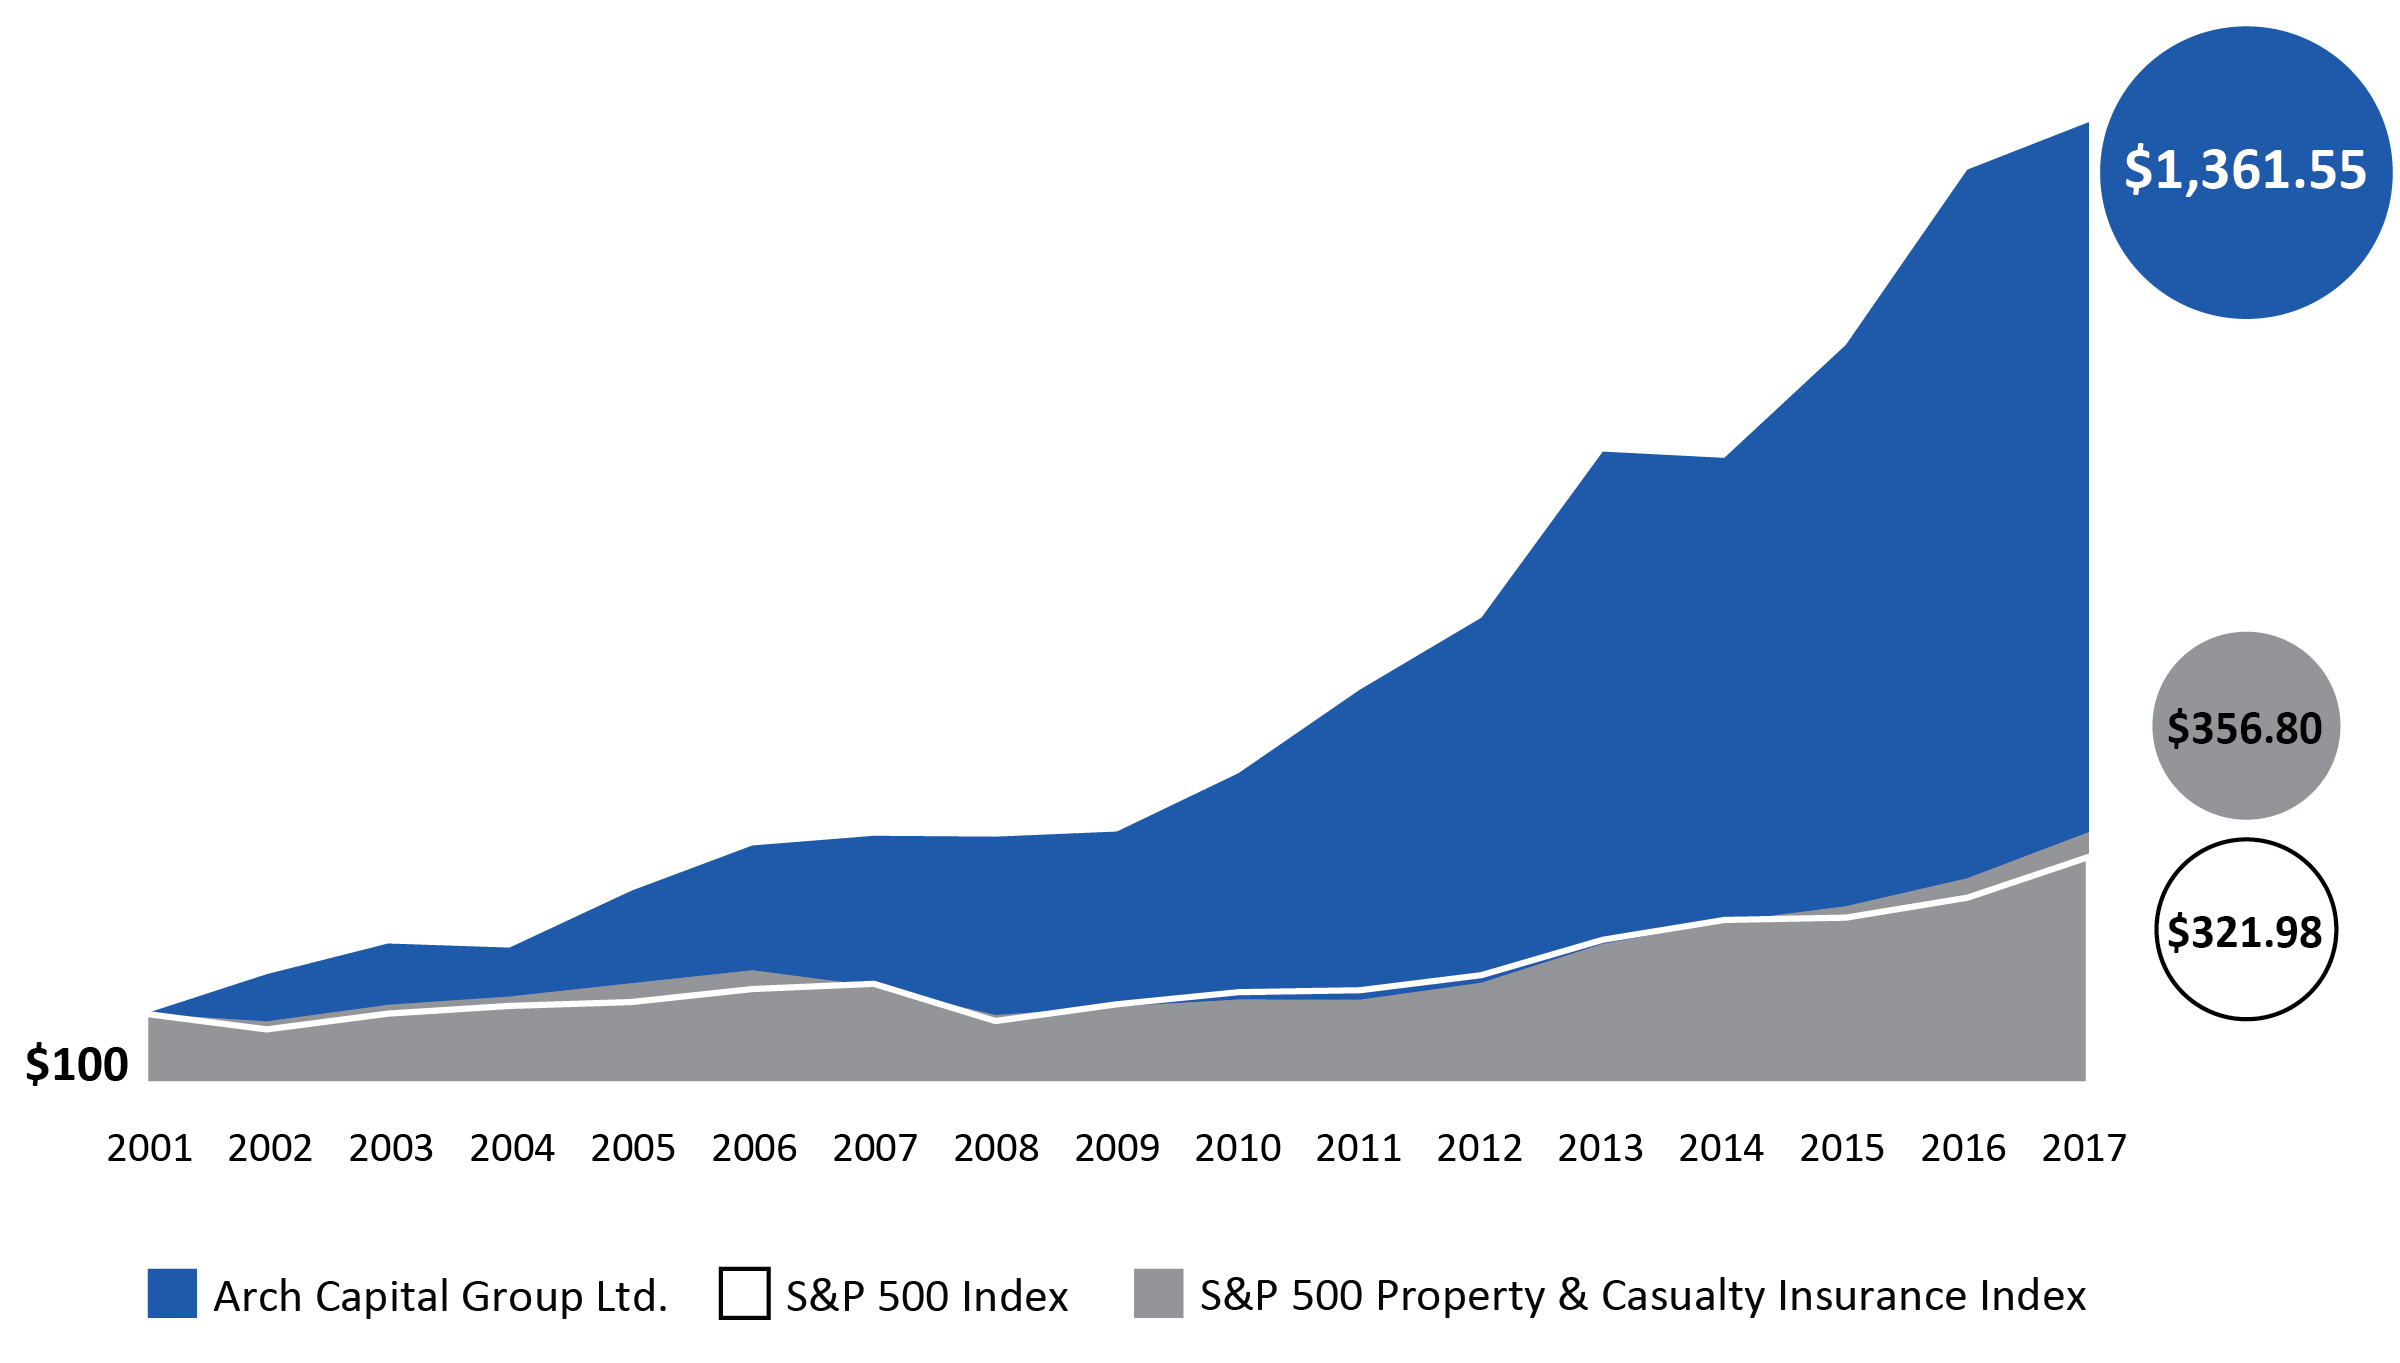
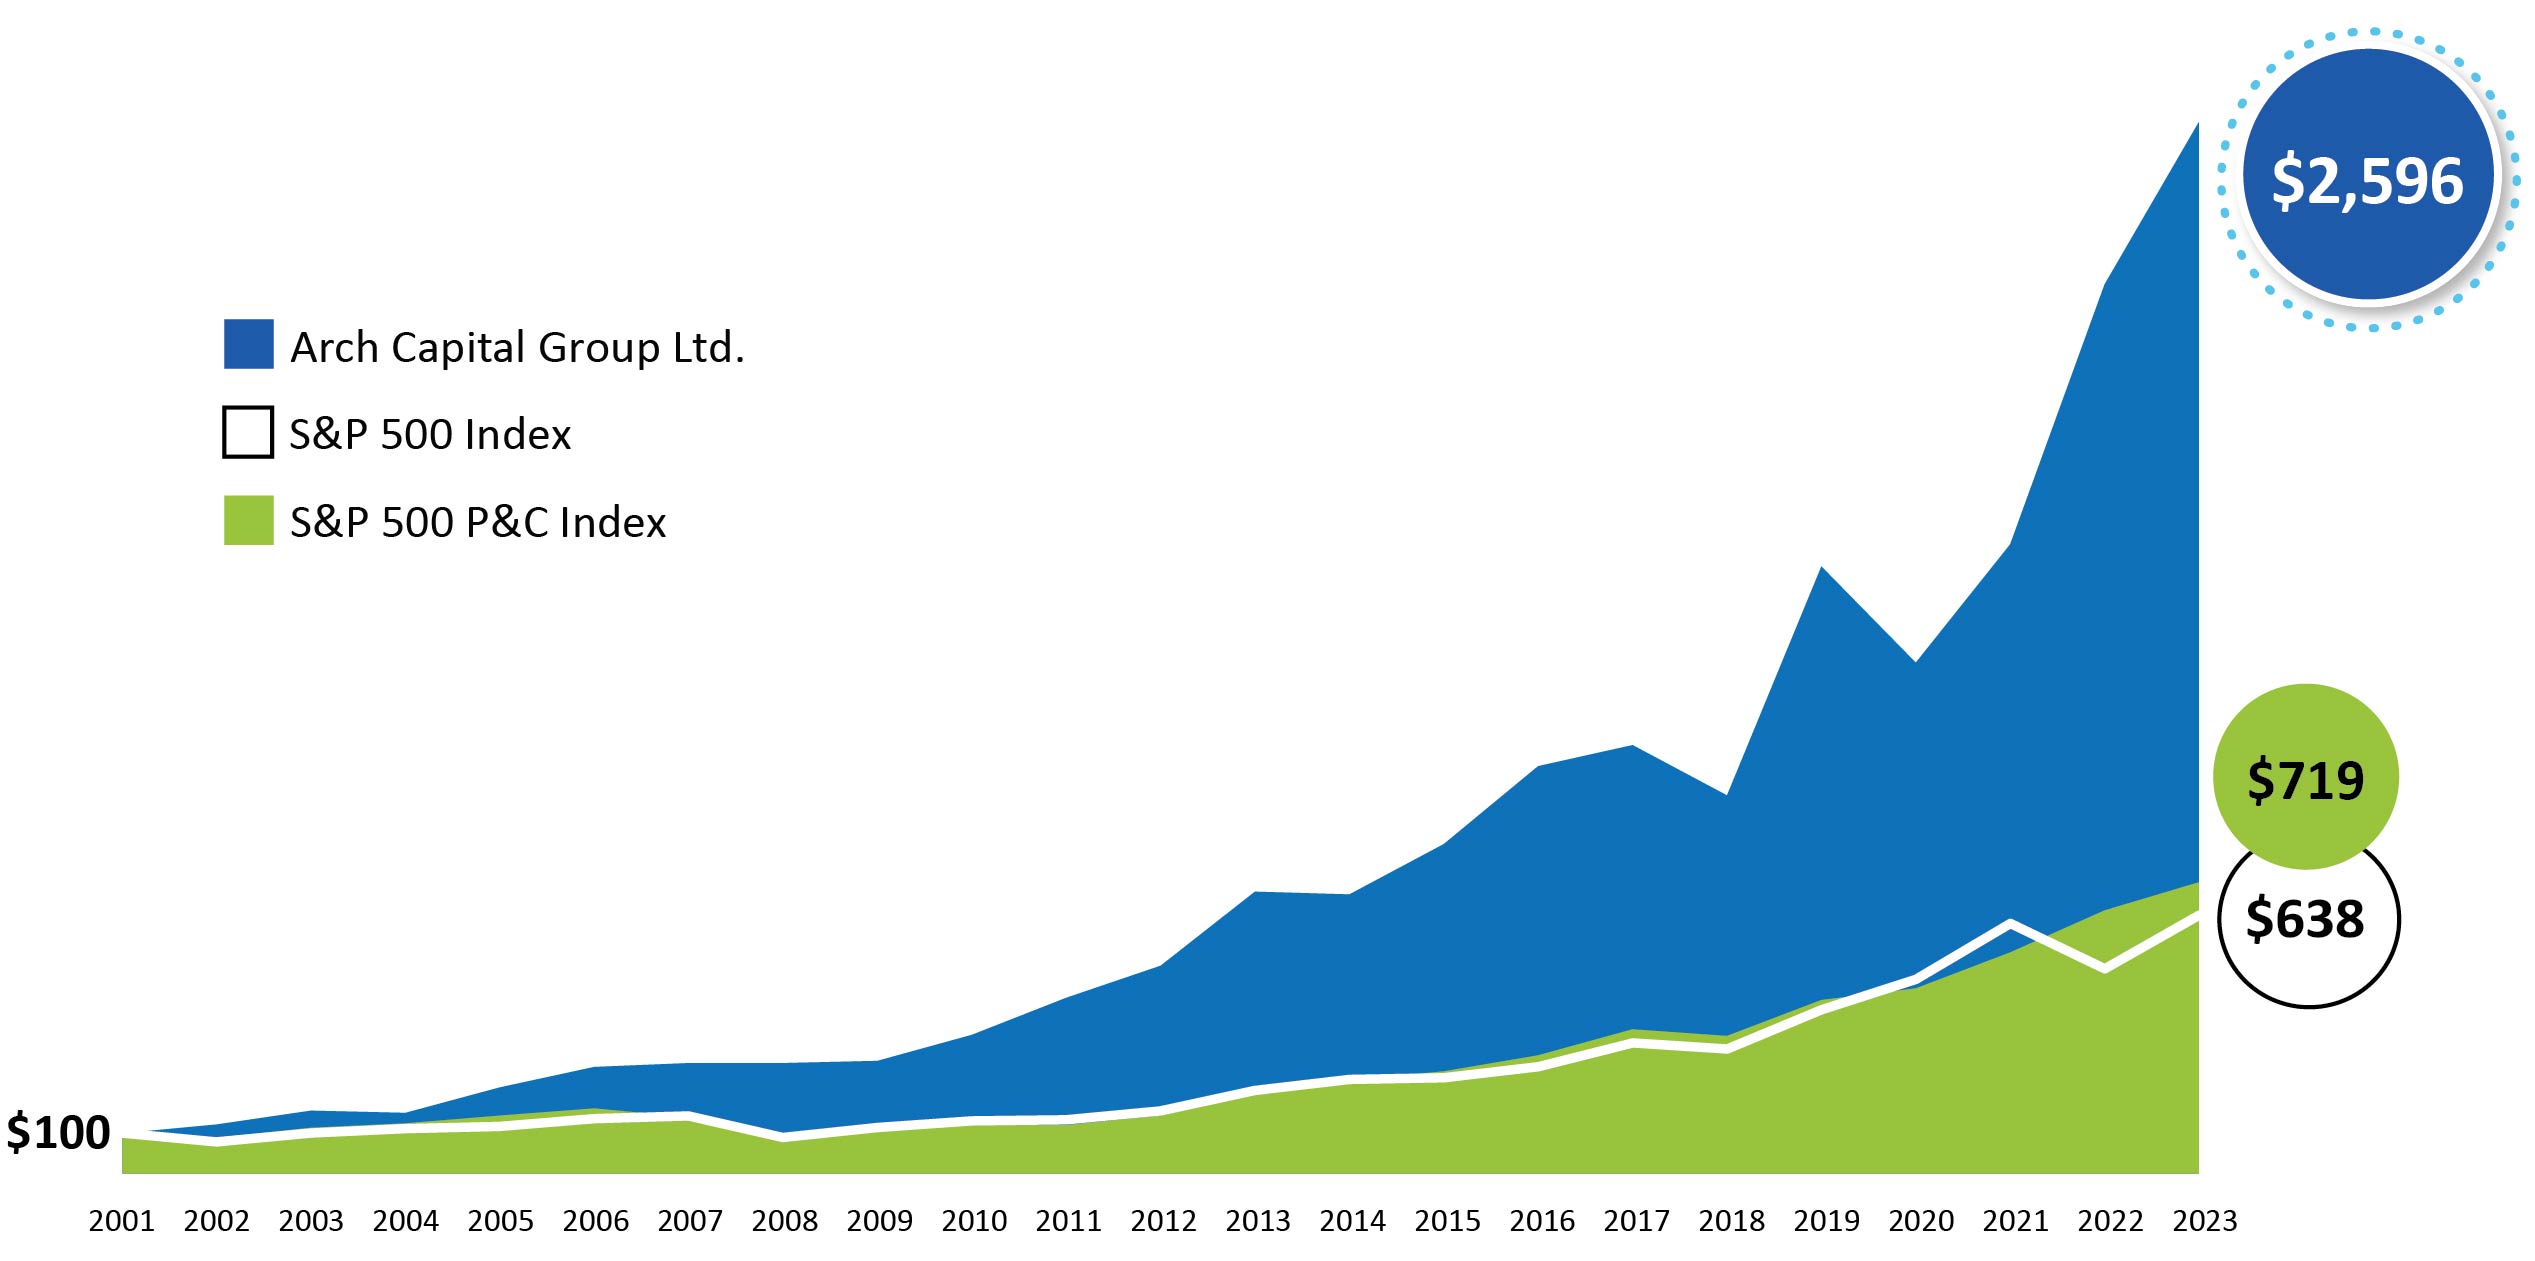
| Total Shareholder Return | ||||||||||||||
| ||
| 39 | | 2024 PROXY STATEMENT | | ||||||
| 2024 PROXY STATEMENT | | 40 | ||||||
| Compensation Peer Group Selection Process | |||||
Step 1: Industry Filters | Select industries relative to Arch Capital’s business operations. | ||||
Step 2: Size Filters | Filter companies based on revenue and asset size. | ||||
Step 3: Additional Subjective Filters | Review business descriptions and additional financial measures. | ||||
| 41 | | 2024 PROXY STATEMENT | | ||||||
| Purpose of the Compensation Peer Group | |||||
| Pay Comparisons | Determine competitive pay levels and identify differences from general industry market data. | ||||
| Assess ability to attract, retain, engage and motivate top talent. | |||||
| Compensation Structure | Provide benchmarks for compensation structure (pay mix, performance metrics, leverage, vehicles, etc.). | ||||
| Use as a foundation or reference when making design changes to the compensation program. | |||||
| Performance Comparisons | Assess performance relative to companies facing similar business challenges. | ||||
| Use as an input to setting incentive plan goals. | |||||
| Financial Performance | Company performance is measured in absolute terms, as well as versus prior year results, and in relative terms in comparison with the performance of peer companies in our Compensation Peer Group on the same financial metrics. | ||||
| 2023 Compensation Peer Group | ||
| American Financial Group, Inc. | ||
| Arthur J. Gallagher & Co. | ||
| Assurant, Inc. | ||
| AXIS Capital Holdings Limited | ||
| Cincinnati Financial Corporation | ||
| CNA Financial Corporation | ||
| Everest Group, Ltd. | ||
| First American Financial Corporation | ||
| The Hanover Insurance Group, Inc. | ||
| The Hartford Financial Services Group | ||
| Markel Corporation | ||
| Old Republic International Corporation | ||
| RenaissanceRe Holdings Ltd. | ||
| Selective Insurance Group, Inc. | ||
| The Travelers Companies, Inc. | ||
| W.R. Berkley Corporation | ||
| Willis Towers Watson Public Limited Company | ||
| 42 | |||||||
| ||
2023 NEO Target Short-Term Incentive Opportunity | |||||||||||
| Name | Base Salary | Target (%) | Target Bonus | ||||||||
| Marc Grandisson | $1,225,000 | 200% | $2,450,000 | ||||||||
| François Morin | $750,000 | 140% | $1,050,000 | ||||||||
| Nicolas Papadopoulo | $850,000 | 165% | $1,402,500 | ||||||||
| Maamoun Rajeh | $780,000 | 140% | $1,092,000 | ||||||||
| David E. Gansberg | $780,000 | 140% | $1,092,000 | ||||||||
Level of Performance1 | ROE Scale | Payout Factor | ||||||
| Threshold | 7.50% | 27.0% | ||||||
| Target | 13.74% | 100.0% | ||||||
| Maximum | 20.61% | 200.0% | ||||||
| 43 | ||||||||
| ||||||||
| ||
| Performance Criteria | Measurement | Weights for Corporate Executives | Weights for Unit Executives | Range of Performance Modifiers | ||
| Financial Metrics - Group Level | The Group Performance Modifier is derived as the weighted average ROE of each of the Operating Units. In order to develop an overall Group-level ROE, the investment unit’s payout multiple (as a % of target) is converted to an implied ROE using the underwriting units’ payout scale. | 70 | % | 20 | % | 0 - 200% |
| Financial Metrics - Operating Unit Level | Under our existing incentive compensation formula plans, bonus awards are determined for each underwriting unit based on ROE measures (measured over the applicable 10-year development periods) and the relative performance of the investment unit compared to the benchmark index (over the past 1, 3 and 5 years). Performance against financial goals for each Unit Executive is evaluated against the overall results of his/her respective plan. | 0% | 50% | 0 - 200% | ||
| Strategic Metrics | Based on year-end performance evaluation. | 30% | 30% | 0 - 250% (1) | ||
| Total | 100% | 100% | 0 - 200% | |||
| Performance Criteria | Measurement | Weights for Corporate Executives | Weights for Unit Executives | Range of Payout Percentages | |||||||||||||
| Financial Metrics— Group Level | The incentive compensation payout multiple at the group level is based on each of the underwriting units’ incentive compensation formula plan multiples and is determined as follows: | 70% | 20% for Reinsurance and Mortgage Executives 50% for President role | 0–200% | |||||||||||||
| 1 | Convert the payout levels for each unit to an ROE-equivalent, which is inferred1 using the current underwriting year’s ROE scale. | ||||||||||||||||
| 2 | Derive a group-wide ROE supporting the incentive compensation formula plans using the unit-specific inferred ROEs, weighted by the capital allocated (or deployed) to each underwriting unit. | ||||||||||||||||
| 3 | Compare the group-wide ROE to the target level ROE for the current year in order to assess the relative performance of the group. | ||||||||||||||||
| 4 | Compute the group-level payout multiple using the applicable scale. | ||||||||||||||||
| Financial Metrics— Segment Level | The incentive compensation payout level for each unit executive measured under this category is equal to his respective unit’s incentive compensation formula plan multiple (total bonus payout dollars for the unit for the current year expressed as a percentage of the aggregate target bonus pool for the unit for the current year), as described in “Overview” above. | 0% | 50% for Reinsurance and Mortgage Executives 20% for President role | 0–200% | |||||||||||||
Strategic Goals2 | Based on each executive’s year-end performance evaluation measuring the achievement of strategic objectives. | 30% | 30% | 0–250% | |||||||||||||
| Total | 100% | 100% | 0–200% | ||||||||||||||
| 2024 PROXY STATEMENT | | 44 | ||||||
| Range of Payouts as % of Target - Financial Goals - Group Level | Threshold | Target | Maximum | ||||||||
Payout as a % of Target1 | 20% | 100% | 200% | ||||||||
| Level of Goal Achievement Required | 85% | 100% | 115% | ||||||||
| Range of Payouts as % of Target - Financial Goals - Segment Level | Threshold | Target | Maximum | ||||||||
Payout as a % of Target1 | 20% | 100% | 200% | ||||||||
| Level of Goal Achievement Required | 50% | 100% | 150% | ||||||||
| Range of Performance Modifiers as % of Target - Financial Goals | Threshold/Minimum | Target | Maximum | |||
| Payout as a % of Target (1) | 20% | 100% | 200% | |||
| Level of Goal Achievement Required: Financial - Group Level | 85 | % | 100 | % | 115 | % |
| Level of Goal Achievement Required: Financial - Operating Unit Level | 50 | % | 100 | % | 150 | % |
| Strategic Performance Rating | Payout1 | ||||
| Exceptional Achievements | 250% | ||||
| Exceeds Expectations | 150% | ||||
| Meets Expectations | 100% | ||||
| Needs Development | 50% | ||||
| Unsatisfactory | 0% | ||||
1 For the strategic criteria (30% weighting), payout modifiers over 200% may only be used if the overall financialgoals (70% weighting) achieve the target level of performance or higher. Also, maximum payout as a percentage of target is capped at 200%. See “2023 Compensation Decisions for NEOs” for details of annual short-term cash incentives paid to the NEOs and discussion of the strategic goals. |
| 45 | ||||||||
| | | | |||||||
Performance Shares 55% of Economic Value | Stock Options 25% of Economic Value | Restricted 20% of Economic Value | ||||||||||||||||||||||||||||||||
Performance Period: Underlying Value: Denoted in shares of Arch Metrics: Opportunities: Pre-established Payout: | + | Vesting: 3-year ratable commencing on the first anniversary of the grant date. Underlying Value: Denoted in non-qualified stock options evaluated using the Black-Scholes methodology. Exercise Price: Equal to the closing share price on the grant date. Life: Black-Scholes Methodology: The grant date fair value is calculated in accordance with the Black-Scholes model. The expected life assumption for options is based on the Company’s historical exercise experience of six years (of a 10-year maximum term). Expected volatility is based on the Company’s daily historical trading data of its common shares. | + | Vesting: 3-year ratable commencing on the first anniversary of the grant date. UnderlyingValue: Denoted in shares of Arch Payout: In shares. Dividends: Accrue and are paid out upon vesting. | ||||||||||||||||||||||||||||||
| 2024 PROXY STATEMENT | | 46 | ||||||||
| ||
| 2023 Performance Peer Group | ||
| American Financial Group, Inc. | ||
| Assurant, Inc. | ||
| AXIS Capital Holdings Limited | ||
| Cincinnati Financial Corporation | ||
| CNA Financial Corporation | ||
| Essent Group Ltd. | ||
| Everest Group, Ltd. | ||
| Fairfax Financial Holdings Limited | ||
| The Hanover Insurance Group, Inc. | ||
| The Hartford Financial Services Group | ||
| Markel Corporation | ||
| MGIC Investment Corporation | ||
| Old Republic International Corporation | ||
| Radian Group Inc. | ||
| RenaissanceRe Holdings Ltd. | ||
| Selective Insurance Group, Inc. | ||
| The Travelers Companies, Inc. | ||
| W.R. Berkley Corporation | ||
| Level of Performance | Growth in TBVPS | Shares Earned as a % of Target | ||||||
| Threshold | 6% | 50% | ||||||
| Target | 11% | 100% | ||||||
| Maximum | 16% | 200% | ||||||
| Name | 2023 Target Grant Value (% of Base Salary) | 2023 Actual Grant Value (% of Base Salary) | ||||||
| Marc Grandisson | 450% | 515% | ||||||
| François Morin | 200% | 230% | ||||||
| Nicolas Papadopoulo | 300% | 345% | ||||||
| Maamoun Rajeh | 200% | 230% | ||||||
| David E. Gansberg | 200% | 230% | ||||||
| 47 | | 2024 PROXY STATEMENT | | ||||||
| ||
| Annual Change in TBVPS | Payout Percentage | TSR Percentile | Shares Modifier | |||||||||||
| <6% | 0% | ≤20% | 75% | |||||||||||
| 6% | 50% | 35% | 100% | |||||||||||
| 11% | 100% | 65% | 100% | |||||||||||
| ≥16% | 200% | ≥80% | 125% | |||||||||||
| 2024 PROXY STATEMENT | | 48 | ||||||
| Chief Executive Officer | ||||||||||||||||||||||||||||||||
Marc Grandisson Chief Executive Officer | ||||||||||||||||||||||||||||||||
| Strategic Goals | ||||||||||||||||||||||||||||||||
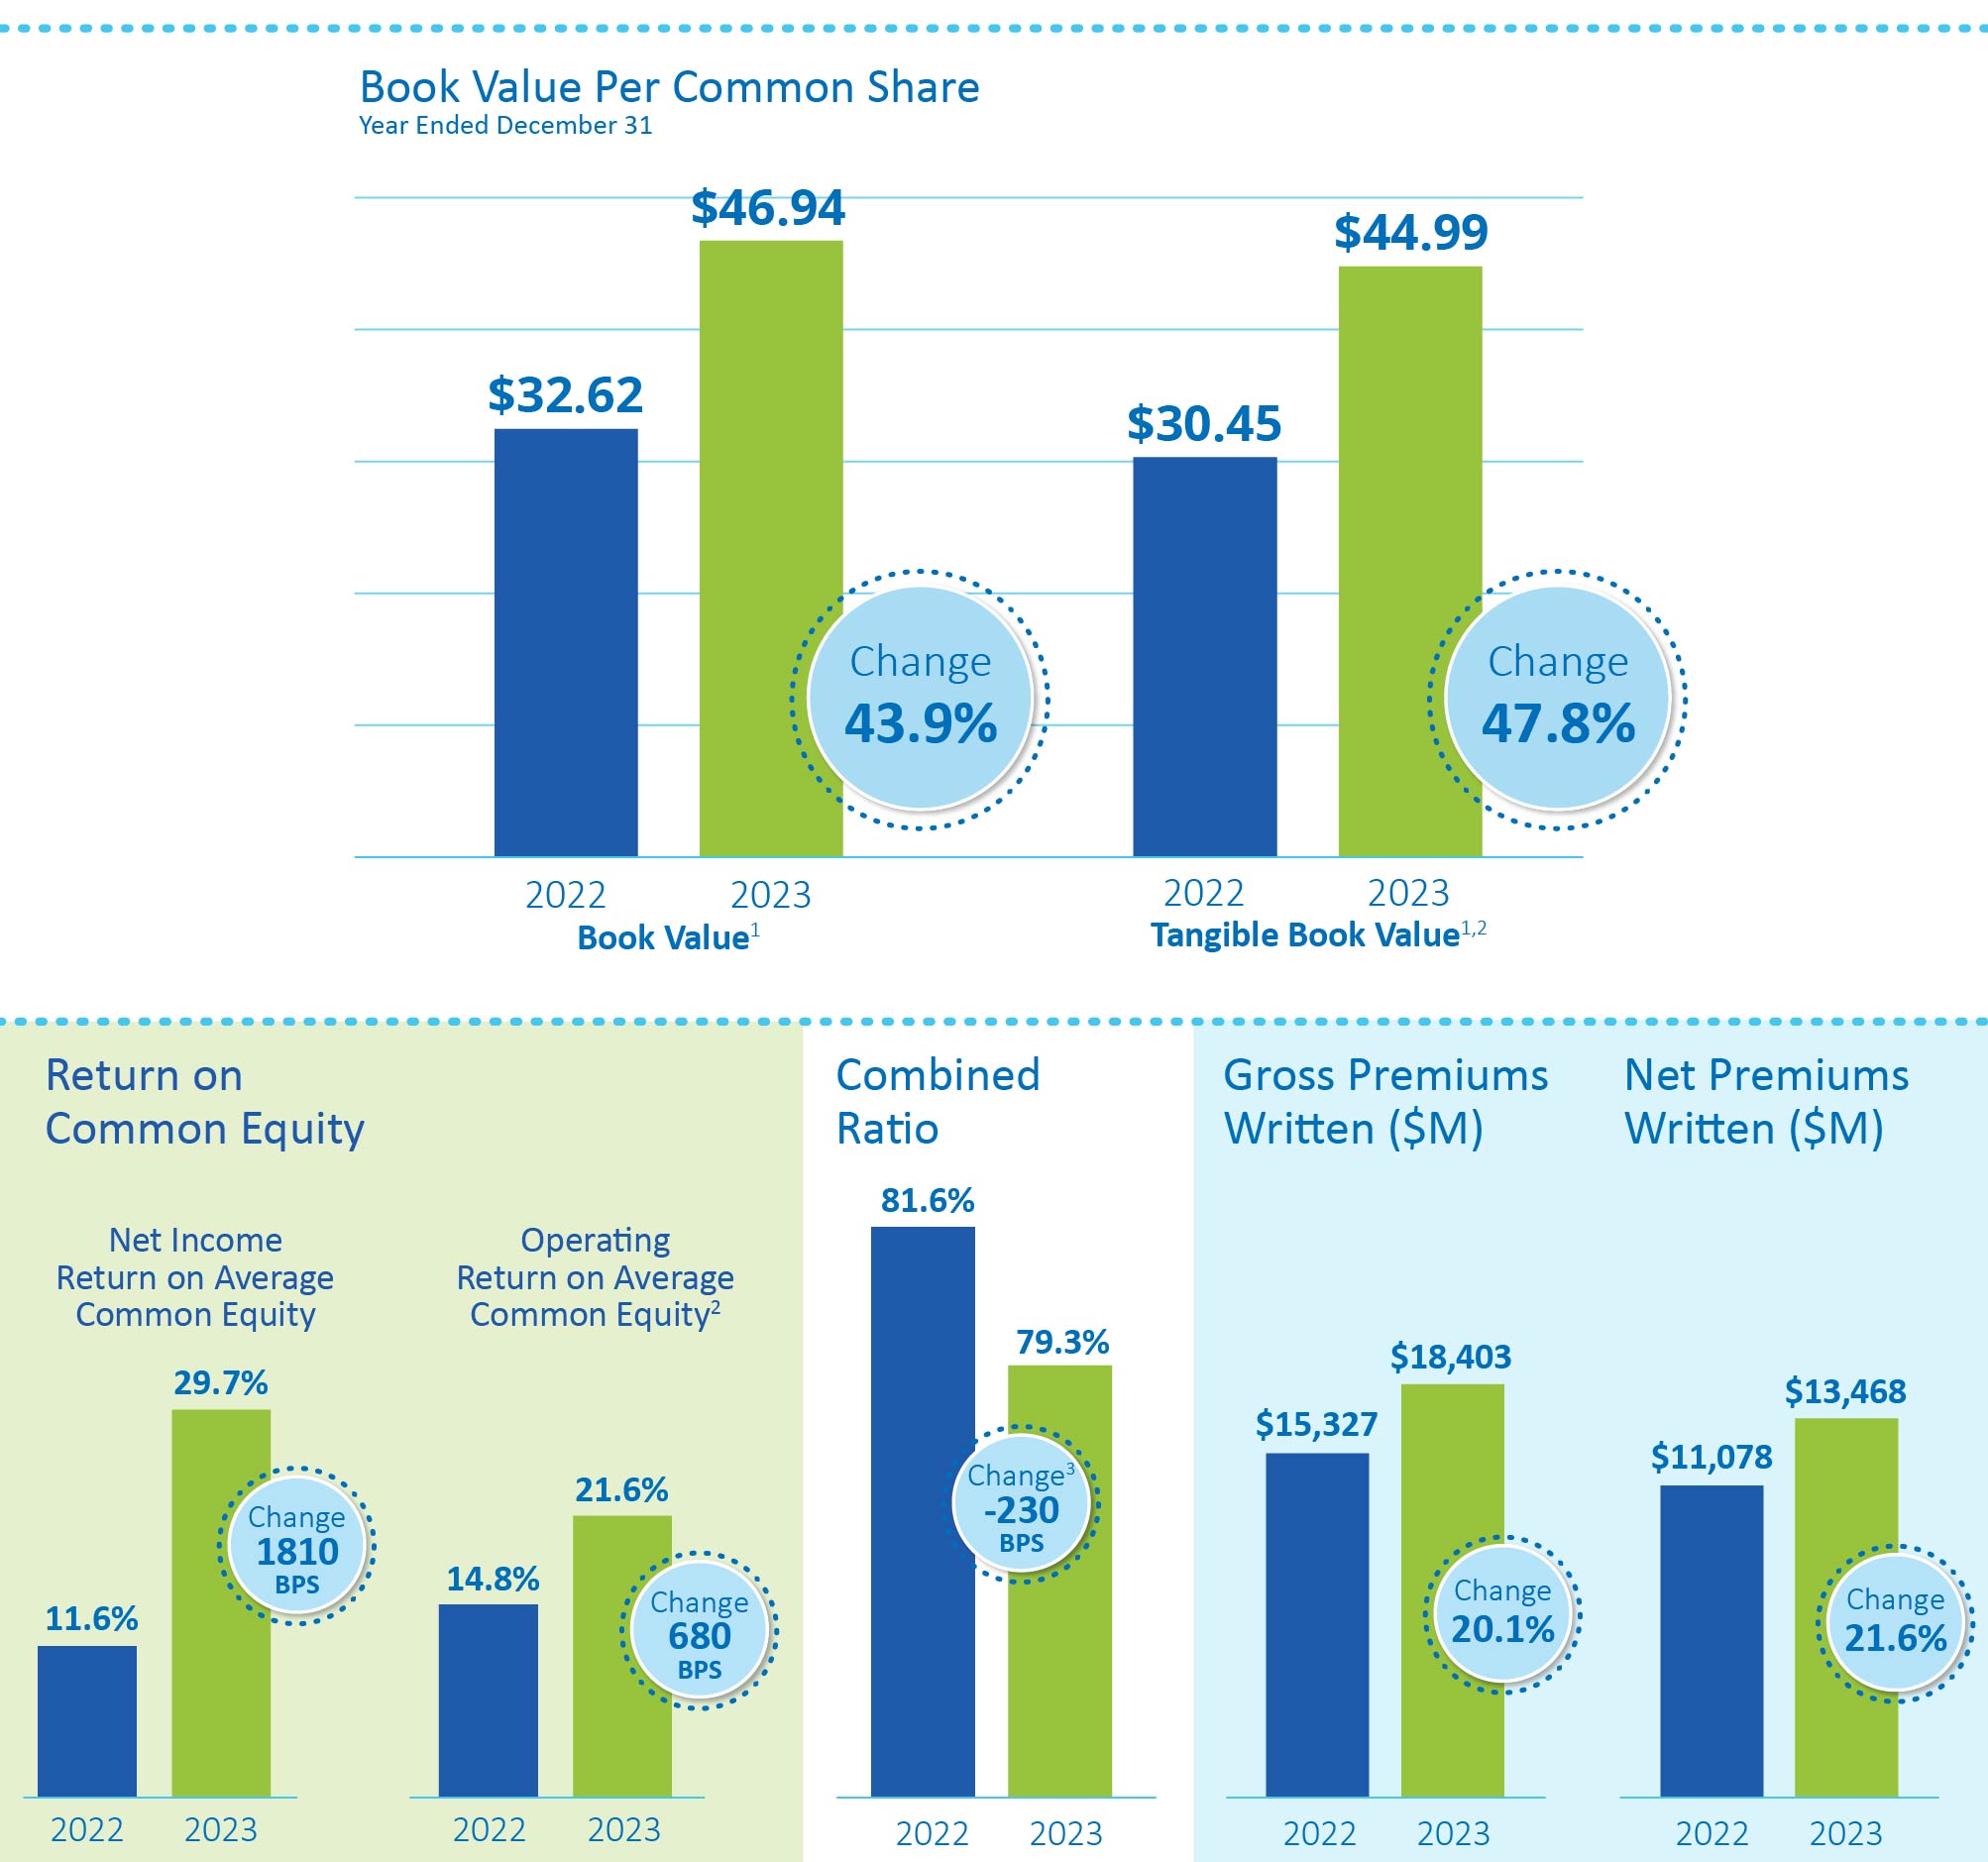
In early 2023, the Compensation and Human Capital Committee reviewed and approved Mr. Grandisson’s 2023 strategic objectives. During the year, the Compensation and Human Capital Committee reviewed updates on the progress toward achievement of the objectives and final determinations were made in February 2024. The resulting determination by the Compensation and Human Capital Committee was that he had performed with respect to his pre-established strategic objectives at a level translating to a 200% payout factor. Highlights are summarized below: Mr. Grandisson’s strategic goals were based on Company performance, including in relation to the Performance Peer Group, progress on key strategic initiatives and succession planning. Under Mr. Grandisson’s leadership, the Company’s financial results were outstanding as highlighted in “2023 Performance at a Glance” section. Book value per common share was up 43.9%, annualized net income return on average common equity and annualized after-tax operating return on average common equity were 29.7% and 21.6%, respectively, compared to 11.6% and 14.8%, respectively, in 2022. The Company’s stock price was up 18.3% in 2023. In addition, the Company was once again named a “Most Honorable Company” placing in the top-three overall in every category by Institutional Investor. The Company was also named Best Places to Work by U.S. News and World Report. The Compensation and Human Capital Committee evaluated Mr. Grandisson’s oversight in developing the Company’s global strategy focusing on revenue growth, operating efficiencies, innovation and increased profitability. The Committee also evaluated Mr. Grandisson’s oversight of succession planning and maximizing Executive Leadership Team effectiveness, while also continuing to inspire the Senior Leadership Team (“SLT”) of the Company’s top ~150 leaders. The Committee also reviewed Mr. Grandisson’s oversight of key strategic initiatives in the areas of analytics, M&A, employee engagement, D&I, and ESG programs and policies, as well as continued progress on global IT transformation and Arch Management System, both of which are multi-year initiatives to upgrade and refresh core processes and systems that will generate productivity, efficiency and consumer centric solutions. | ||||||||||||||||||||||||||||||||
| Compensation Decisions | ||||||||||||||||||||||||||||||||
■ Base Salary, Short- and Long-Term Incentive Target | Mr. Grandisson did not have any change to base salary or short- and long-term incentive targets in 2023. For 2024 compensation decisions, the Compensation and Human Capital Committee reviewed and benchmarked Mr. Grandisson’s compensation against the Company’s Compensation Peer Group. Based on that review, in order to maintain market competitiveness at our target positioning as described in “How We Make Compensation Decisions,” Mr. Grandisson’s base salary was increased to $1,300,000 from $1,225,000 in January 2024 and his long-term incentive target was increased to 560% of base salary from 450% of base salary. His short-term incentive remains at 200% of base salary. | |||||||||||||||||||||||||||||||
■ Short-Term Cash Incentive | The Compensation and Human Capital Committee reviewed Mr. Grandisson’s performance against his strategic goals, which resulted in a payout factor of 200% on the portion of his bonus that was based on strategic performance. | |||||||||||||||||||||||||||||||
| 2023 STI Metric | Payout Factor | x Weighting | = Adjusted Weighting | x Target Bonus | = Bonus Payout (Max 2x) | |||||||||||||||||||||||||||
| Financial Performance—Group | 200% | 70% | 140% | $2,450,000 | $3,430,000 | |||||||||||||||||||||||||||
| Strategic Performance | 200% | 30% | 60% | 1,470,000 | ||||||||||||||||||||||||||||
| TOTAL | 100% | 200% | $4,900,000 | |||||||||||||||||||||||||||||
■ Long-Term Incentive | On February 24, 2023, the Compensation and Human Capital Committee approved the annual award summarized in the table below. The amount includes a 15% increase to the grant target in recognition of the Company’s outstanding performance in 2022. The performance shares are reflected at target since performance will be measured over the forward-looking three-year period, which will ultimately determine the number of shares earned. | |||||||||||||||||||||||||||||||
| Performance Shares | Stock Options | Time-Based Restricted Shares | ||||||||||||||||||||||||||||||
| Grant Date | Number of Shares | Value1 | Number of Options | Value1 | Number of Shares | Value1 | Total | |||||||||||||||||||||||||
| Feb. 24, 2023 | 50,193 | $3,471,850 | 67,242 | $1,578,304 | 18,252 | $1,262,491 | $6,312,645 | |||||||||||||||||||||||||
■ 2021 Perfor-mance Share Cycle Vesting | The starting TBVPS for the 2021 grants was $28.63. At the end of 2023, TBVPS grew to $44.99, a 16.26% annualized increase over the performance period, resulting in a payout percentage of 200%, based on TBVPS growth. Based on Arch Capital’s TSR over the three-year performance period of 122.9%, which placed it in the 100th percentile of our Performance Peer Group, the resulting TSR multiplier was 125.0%, and the overall payout factor was calculated at 200.0%, which was the maximum payout. | |||||||||||||||||||||||||||||||
| 2021 Grant (Target) | Approved Payout Factor | Total Vested | Adjustment to Target Shares Awarded | Value of Adjustment to Target Shares at 12/31/20232 | ||||||||||||||||||||||||||||
| 69,095 | 200.0% | 138,190 | 69,095 | $5,131,686 | ||||||||||||||||||||||||||||
1 The total long-term incentive value provided in the summary above for performance share awards differs from the grant date fair value reported in the “2023 Summary Compensation” and “2023 Grants of Plan-Based Awards” Tables. The values in the summary above were based on the closing price of our shares on the grant date and the target number of shares. The values in the “2023 Summary Compensation” and “2023 Grants of Plan-Based Awards” Tables were computed at the grant date in accordance with ASC Topic 718. Stock options are valued on the grant date based on the Black-Scholes option pricing methodology (refer to “Elements of Compensation Program—Long-Term Incentive Plan”) and restricted shares are valued based on the closing price of our common shares on the grant date. 2 The Value of Adjustment to Target Shares is calculated utilizing the December 31, 2023 closing stock price of Arch Capital, which was $74.27. | ||||||||||||||||||||||||||||||||
| 49 | | 2024 PROXY STATEMENT | | ||||||
| Chief Financial Officer | ||||||||||||||||||||||||||
François Morin Executive Vice President, Chief Financial Officer and Treasurer | ||||||||||||||||||||||||||
| Strategic Goals | ||||||||||||||||||||||||||
| Mr. Morin’s strategic goals were based on our financial strength ratings, strategic initiatives, updating of financials systems, finance operations and processes and succession planning. Mr. Morin worked successfully at managing investor, rating agency and auditor relations to keep our financial strength ratings strong. He also led capital management decisions across the group resulting in 21.6% growth in net written premium and after-tax operating income growth of 74.2% from 2022. The Compensation and Human Capital Committee evaluated Mr. Morin’s role in strategic initiatives, including corporate structuring designed to enhance Company capital and provide financial flexibility for the future. In addition, Mr. Morin led the successful implementation of Phase 1 of the multi-year finance transformation to implement a single Enterprise Resource Planning (“ERP”) solution across the group. Mr. Morin also continued to identify the next generation of leaders through the SLT and succession planning process and encouraged team building for the various corporate functions by helping to lead a first-ever Corporate Collaboration Conference for 160-plus employees across the corporate functions. Mr. Morin also joined the Company’s mentorship program and mentors a number of individuals across different teams. | ||||||||||||||||||||||||||
| Compensation Decisions | ||||||||||||||||||||||||||
■ Base Salary | Mr. Morin’s base salary was increased to $750,000 from $675,000 in January 2023 following our annual benchmarking review, company growth and continued high performance. For 2024 compensation decisions, Mr. Morin’s base salary was increased to $800,000 from $750,000 following our annual benchmarking review, effective January 1, 2024. | |||||||||||||||||||||||||
■ Short-Term Cash Incentive | The Compensation and Human Capital Committee reviewed Mr. Morin’s performance against his strategic goals, which resulted in a payout factor of 210% on the portion of his bonus that was based on strategic performance. | |||||||||||||||||||||||||
| 2023 STI Metric | Payout Factor | x Weighting | = Adjusted Weighting | x Target Bonus | = Bonus Payout (Max 2x) | |||||||||||||||||||||
| Financial Performance—Group | 200% | 70% | 140% | $1,050,000 | $1,470,000 | |||||||||||||||||||||
| Strategic Performance | 210% | 30% | 63% | 630,000 | ||||||||||||||||||||||
| TOTAL | 100% | 203% | $2,100,000 | |||||||||||||||||||||||
| Effective January 1, 2023, Mr. Morin’s Short-Term Cash Incentive target was increased to 140% of base salary from 135% of base salary following our annual benchmarking review. For 2024 compensation decisions, Mr. Morin’s Short-Term Cash Incentive target was increased to 150% of base salary from 140% of base salary following our annual benchmarking review, effective January 1, 2024. | ||||||||||||||||||||||||||
■ Long-Term Incentive | On February 24, 2023, the Compensation and Human Capital Committee approved the annual award summarized in the table below. The amount includes a 15% increase to the grant target in recognition of the Company’s outstanding performance in 2022. The performance shares are reflected at target since performance will be measured over the forward-looking three-year period, which will ultimately determine the number of shares earned. | |||||||||||||||||||||||||
| Performance Shares | Stock Options | Time-Based Restricted Shares | ||||||||||||||||||||||||
| Grant Date | Number of Shares | Value1 | Number of Options | Value1 | Number of Shares | Value1 | Total | |||||||||||||||||||
| Feb. 24, 2023 | 13,716 | $948,736 | 18,375 | $431,298 | 4,988 | $345,020 | $1,725,054 | |||||||||||||||||||
■ 2021 Perfor-mance Share Cycle Vesting | The starting TBVPS for the 2021 grants was $28.63. At the end of 2023, TBVPS grew to $44.99, a 16.26% annualized increase over the performance period, resulting in a payout percentage of 200%, based on TBVPS growth. Based on Arch Capital’s TSR over the three-year performance period of 122.9%, which placed it in the 100th percentile of our Performance Peer Group, the resulting TSR multiplier was 125.0%, and the overall payout factor was calculated at 200.0%, which was the maximum payout. | |||||||||||||||||||||||||
| 2021 Grant (Target) | Approved Payout Factor | Total Vested | Adjustment to Target Shares Awarded | Value of Adjustment to Target Shares at 12/31/20232 | ||||||||||||||||||||||
| 20,729 | 200.0% | 41,458 | 20,729 | $1,539,543 | ||||||||||||||||||||||
1 The total long-term incentive value provided in the summary above for performance share awards differs from the grant date fair value reported in the “2023 Summary Compensation” and “2023 Grants of Plan-Based Awards” Tables. The values in the summary above were based on the closing price of our shares on the grant date and the target number of shares. The values in the “2023 Summary Compensation” and “2023 Grants of Plan-Based Awards” Tables were computed at the grant date in accordance with ASC Topic 718. Stock options are valued on the grant date based on the Black-Scholes option pricing methodology (refer to “Elements of Compensation Program—Long-Term Incentive Plan”) and restricted shares are valued based on the closing price of our common shares on the grant date. 2 The Value of Adjustment to Target Shares is calculated utilizing the December 31, 2023 closing stock price of Arch Capital, which was $74.27. | ||||||||||||||||||||||||||
| 2024 PROXY STATEMENT | | 50 | ||||||
| President and Chief Underwriting Officer | ||||||||||||||||||||||||||
Nicolas Papadopoulo President and Chief Underwriting Officer, Arch Capital and CEO, Arch Worldwide Insurance Group | ||||||||||||||||||||||||||
| Strategic Goals | ||||||||||||||||||||||||||
Mr. Papadopoulo’s strategic goals included growth strategies, strategic initiatives, leadership development, and D&I initiatives. Mr. Papadopoulo continues to build alignment and common strategies around future growth for all of Arch’s segments, i.e., Insurance, Reinsurance and Mortgage. Under Mr. Papadopoulo’s leadership, Insurance group net written premiums grew 16.7% from 2022. The Compensation and Human Capital Committee also evaluated Mr. Papadopoulo’s role in strategic initiatives, including sponsoring the expansion of the Shared Service Operating Model and prioritization of next steps for the companywide transformation agenda after the successful implementation of the HR Talent Acquisition and IT End User Support pilots. Mr. Papadopoulo also focused on further expanding the use of strategic analytics and digital partnership successes to continue to drive innovation and increase profitability, and he continued to support the development of leaders and the framework specific to the next generation of successors. Mr. Papadopoulo also promoted the Company’s D&I initiatives across business units, including segment specific D&I goals and continues to serve as Executive Sponsor of the Women and Allies Employee Network. | ||||||||||||||||||||||||||
| Compensation Decisions | ||||||||||||||||||||||||||
■ Base Salary | Mr. Papadopoulo’s base salary was increased to $850,000 from $800,000 in January 2023 following our annual benchmarking review, company growth and continued high performance. For 2024 compensation decisions, Mr. Papadopoulo’s base salary was increased to $900,000 from $850,000 following our annual benchmarking review, effective January 1, 2024. | |||||||||||||||||||||||||
■ Short-Term Cash Incentive | The Compensation and Human Capital Committee reviewed Mr. Papadopoulo’s performance against his strategic goals, which resulted in a payout factor of 225% on the portion of his bonus that was based on strategic performance. | |||||||||||||||||||||||||
| 2023 STI Metric | Payout Factor | x Weighting | = Adjusted Weighting | x Target Bonus | = Bonus Payout (Max 2x) | |||||||||||||||||||||
| Financial Performance—Group | 200% | 50% | 100% | $1,402,500 | $1,402,500 | |||||||||||||||||||||
| Financial Performance—Segment | 164% | 20% | 32.8% | 460,020 | ||||||||||||||||||||||
| Strategic Performance | 225% | 30% | 67.5% | 942,480 | ||||||||||||||||||||||
| TOTAL | 100% | 200.3% | $2,805,000 | |||||||||||||||||||||||
| Effective January 1, 2023, Mr. Papadopoulo’s Short-Term Cash Incentive target was increased to 165% of base salary from 150% of base salary following our annual benchmarking review. For 2024 compensation decisions, Mr. Papadopoulo’s Short-Term Cash Incentive target was increased to 185% of base salary from 165% of base salary following our annual benchmarking review, effective January 1, 2024. | ||||||||||||||||||||||||||
■ Long-Term Incentive | On February 24, 2023, the Compensation and Human Capital Committee approved the annual award summarized in the table below. The amount includes a 15% increase to the grant target in recognition of the Company’s outstanding performance in 2022. The performance shares are reflected at target since performance will be measured over the forward-looking three-year period, which will ultimately determine the number of shares earned. | |||||||||||||||||||||||||
| Performance Shares | Stock Options | Time-Based Restricted Shares | ||||||||||||||||||||||||
| Grant Date | Number of Shares | Value1 | Number of Options | Value1 | Number of Shares | Value1 | Total | |||||||||||||||||||
| Feb. 24, 2023 | 23,337 | $1,614,220 | 31,264 | $733,829 | 8,486 | $586,977 | $2,935,026 | |||||||||||||||||||
■ 2021 Perfor-mance Share Cycle Vesting | The starting TBVPS for the 2021 grants was $28.63. At the end of 2023, TBVPS grew to $44.99, a 16.26% annualized increase over the performance period, resulting in a payout percentage of 200%, based on TBVPS growth. Based on Arch Capital’s TSR over the three-year performance period of 122.9%, which placed it in the 100th percentile of our Performance Peer Group, the resulting TSR multiplier was 125.0%, and the overall payout factor was calculated at 200.0%, which was the maximum payout. | |||||||||||||||||||||||||
| 2021 Grant (Target) | Approved Payout Factor | Total Vested | Adjustment to Target Shares Awarded | Value of Adjustment to Target Shares at 12/31/20232 | ||||||||||||||||||||||
| 36,851 | 200.0% | 73,702 | 36,851 | $2,736,924 | ||||||||||||||||||||||
1 The total long-term incentive value provided in the summary above for performance share awards differs from the grant date fair value reported in the “2023 Summary Compensation” and “2023 Grants of Plan-Based Awards” Tables. The values in the summary above were based on the closing price of our shares on the grant date and the target number of shares. The values in the “2023 Summary Compensation” and “2023 Grants of Plan-Based Awards” Tables were computed at the grant date in accordance with ASC Topic 718. Stock options are valued on the grant date based on the Black-Scholes option pricing methodology (refer to “Elements of Compensation Program—Long-Term Incentive Plan”) and restricted shares are valued based on the closing price of our common shares on the grant date. 2 The Value of Adjustment to Target Shares is calculated utilizing the December 31, 2023 closing stock price of Arch Capital, which was $74.27. | ||||||||||||||||||||||||||
| 51 | | 2024 PROXY STATEMENT | | ||||||
| Reinsurance Unit Executive | |||||||||||||||||||||||||||||||||||||||||||||||||||||||||||||||||||||||||||||||||||||||||||||||||||||||||||||||||||||||||||||||||||||||||||||||||||||||||||||||||||||||||||||||||||||||||||||||||||||||||||||||||||||||||||||||||||||||||||||||||||||||||||||||||||||||||||||||||||||||||||||||||||||||||||||||||||||||||||||||||||||||||||||||||||||||||||||||||||||||||||||||||||||||||||||||||||||||||||||||||||||||||||||||||||||||||||||||||||||||||||||||||||||||||||||||||||||||||||||||||||||||||||||||||||||||||||||||||||||||||||||||||||||||||||||||||||||||||||||||||||||||||||||||||||||||||||||||||||||||||||||||||||||||||||||||||||||||||||||||||||||||||||||||||||||||||||||||||||||||||||||||||||||||||||||||||||||||||||||||||||||||||||||||||||||||||||||||||||||||||||||||||||||||||||||||||||||||||||||||||||||||||||||||||||||||||||||||||||||||||||||||||||||||||||||||||||||||||||||||||||||||||||||||||||||||||||||||||||||||||||||||||||||||||||||||||||||||||||||||||||||||||||||||||||||||||||||||||||||||
▪reviewed and advised the Compensation and Human Capital Committee on matters concerning compensation of the CEO and our other NEOs; ▪reported on all aspects of ▪assessed the companies in the Compensation Peer Group for continued appropriateness; ▪reported on emerging trends and developments in executive compensation and corporate governance; ▪prepared formal presentations for the Compensation and Human Capital Committee regarding executive compensation; ▪reviewed compensation benchmarking analysis for each of the Company’s senior executives; and ▪reviewed and advised on director compensation. Meridian did not provide any other services to the Company and no other fees were paid to Meridian except fees related to their services to the Compensation and Human Capital Committee. The Compensation and Human Capital Committee believes that Meridian is independent and no conflict of interest exists. Competitors for Setting Pay and Comparing Performance For purposes of making compensation decisions and for evaluating our financial performance relative to peers, we used compensation and financial data derived from the Compensation Peer Group listed below. We annually review the companies in our Compensation Peer Group with Meridian. Prior to the Compensation and Human Capital Committee making 2023 compensation decisions, the Compensation and Human Capital Committee conducted a formal review of the Compensation Peer Group, with assistance from Meridian, resulting in a recommendation to keep the same Compensation Peer Group as in effect for the prior year, which was approved by the Compensation and Human Capital Committee. The table below describes the multi-step filtering exercise used in the Compensation Peer Group selection process:
The table below describes the four primary functions for the Compensation Peer Group:
The Compensation Peer Group used for 2023 compensation decisions was comprised of the following 17 companies:
The Compensation and Human Capital Committee utilizes a separate peer group to measure relative TSR performance in our performance share awards (the “Performance Peer Group”). There is significant overlap between the two peer groups, with 14 companies included in both groups, but there are differences that reflect the different purposes of the compensation and performance peer groups. The Compensation Peer Group is used primarily to benchmark our compensation against companies that we compete with for talent, while the Performance Peer Group is more focused on companies that participate in similar lines of business in order to more closely measure our relative TSR performance. In establishing the Performance Peer Group for 2023, the Compensation and Human Capital Committee started with the Compensation Peer Group, added Essent Group Ltd., Fairfax Financial Holdings Limited, MGIC Investment Corporation and Radian Group, Inc. and removed Arthur J. Gallagher & Co., First American Financial Corporation and Willis Towers Watson Public Limited Company, resulting in the 18 companies listed below under “Elements of Compensation—Long Term Incentive Plan.” Shareholder Engagement and Results of Say-on-Pay Votes At our 2023 annual general meeting of shareholders, approximately 93.9% of the votes cast approved the Company’s executive compensation programs and the resulting compensation described in the 2023 Proxy Statement. Based on this high level of support, the Compensation and Human Capital Committee determined that shareholders support our compensation practices and will continue to work to ensure that our NEOs’ interests are aligned with our shareholders’ interests to support long-term value creation. In addition, we continue to engage our largest institutional shareholders in discussions regarding our executive compensation program and other governance matters, including our ESG program, as outlined above (see “Proxy Summary”). We remain committed to listening to feedback from shareholders when designing, reviewing and evaluating our compensation programs and policies.
Elements of Compensation Program We have three primary elements of total direct compensation for our executive compensation program: base salary, short-term cash incentive and long-term incentive share-based awards, all of which are described below. We also provide standard retirement and benefit plans and limited perquisites customarily provided to expatriates residing in Bermuda. Base Salary Short-Term Annual Cash Incentive For each executive participant, target annual cash incentive award levels are established, stated as a percentage of base salary. These levels are influenced by external market data Short-term annual cash incentive award levels are designed to provide formulaic payouts to our senior executives and serve as a critical tool for rewarding the achievement of annual corporate and individual goals. Amounts are earned based on the attainment of quantitative and qualitative strategic accomplishments for the relevant year. The table below sets forth the established target bonus award levels for our NEOs as of December 31, 2023:
The financial metrics are measured based on the financial performance
1 The threshold and maximum levels have been a consistent percentage of the target level over time. However, starting in 2020, the Compensation and Human Capital Committee determined that no amounts will be payable for a plan year unless the ROE for the plan year equals at least 7.5%. Under the formula plans, for underwriting units, payouts are determined based on the unit’s performance during the current calendar year across all open underwriting years
Strategic goals are designed to incentivize participants to achieve corporate objectives that cannot be measured by financial metrics and are approved by the Compensation and Human Capital Committee at the beginning of each year. Performance against strategic goals is evaluated by the Compensation and Human Capital Committee at the conclusion of the calendar year. The strategic goals for each of our NEOs for 2023 are discussed below under “2023 Compensation Decisions for NEOs.” Performance Criteria The following performance criteria and weights apply for corporate and unit executives. ▪Corporate executives include our CEO and CFO who have a broad set of responsibilities across the entire group and no specific underwriting unit profit and loss responsibilities. ▪Unit executives have profit and loss responsibilities for a specific underwriting unit and in 2023, included Messrs. Papadopoulo, Rajeh and Gansberg. Corporate executives’ 70% financial performance metric weighting is based on overall group performance, while the Reinsurance and Mortgage executives’ 70% financial metric weighting is based 50% on the results of the formula plan for their respective unit and 20% on overall group performance, in order to further incentivize them to support overall group objectives. For the President’s role, the 70% financial performance metric weighting is based 50% on overall group performance and 20% on Insurance segment performance. The chart below summarizes the performance criteria structure:
1 An ROE equivalent for a given unit is inferred by determining the ROE that would be required under the current underwriting year’s ROE scale to produce a payout multiple equal to the unit’s actual incentive compensation formula plan payout. 2 For the strategic criteria, payout percentages over 200% may only be used if the overall financial criteria payout percentage is 100% (i.e., target level of performance) or higher. The overall maximum bonus payment cannot exceed 200% of the target amount.
2023 Year ROE Scale/Financial Goals/Payout Scale The two tables below show the (i) 2023 year ROE scale and (ii) payout scale at the threshold, target and maximum levels for each level of financial goal achievement. Each year, in connection with setting the current year’s threshold, target and maximum ROE measures, the Compensation and Human Capital Committee reviews prevailing financial and economic conditions and uncertainties, the current interest rate environment and peer analysis. The Compensation and Human Capital Committee endeavors to set target ROE measures that are rigorous and responsive to the continued challenging environment in the insurance, reinsurance and mortgage industry and that deliver a pay-for-performance culture. For 2023, the Compensation and Human Capital Committee set the ROE target at 13.74%.
1 Payout for performance achievement between stated levels is interpolated on a straight-line basis. The table below shows the payout percentages at each performance rating for strategic performance criteria:
1 For the strategic criteria (30% weighting), payout modifiers over 200% may only be used if the overall financialgoals (70% weighting) achieve the target level of performance or higher. Also, maximum payout as a percentage of target is capped at 200%. See “2023 Compensation Decisions for NEOs” for details of annual short-term cash incentives paid to the NEOs and discussion of the strategic goals.
Long-Term Incentive Plan Overview The Company grants long-term equity-based incentive awards to link the compensation of our NEOs directly to corporate performance over the long term and align the interests of executives to our shareholders. A majority of the economic value is granted in performance-based vehicles. The mix of such long-term awards is approximately (i) 80% performance-based, consisting of 55% performance shares and 25% stock options and (ii) 20% time-based restricted shares. The performance shares are subject to both service-based conditions and performance-based vesting conditions and directly link pay with performance and create shareholder alignment. The stock options also align executives’ interests with those of shareholders and focus on driving stock price. Time-based restricted shares promote direct retention and shareholder alignment. These awards make up a significant component of total direct compensation, and we believe that the combination of awards supports our pay-for-performance philosophy by encouraging long-term performance and shareholder value creation. Long-term incentive award grants are generally made annually at the beginning of each year, and the performance shares have three-year overlapping performance periods. In addition, during the year, additional equity awards may be granted for critical retention situations, newly hired employees and special recognition. The summary below describes the vesting conditions and other relevant data relating to the annual long-term equity program.
The financial metric against which we measure Company performance under our performance shares is based on growth in TBVPS. We selected this metric because higher and more consistent TBVPS growth over time is an indication of effective and prudent use of capital and is shown to deliver value over time. We also believe that performance in relation to our Performance Peer Group is important in evaluating our long-term performance. Accordingly, we have incorporated a relative TSR modifier into the design for several reasons, most significantly its likely correlation to long-term growth in TBVPS and direct correlation with our shareholders’ returns over the performance period.
2023 Long-Term Incentive Awards The Compensation and Human Capital Committee endeavors to set rigorous goals for the performance share awards. The awards granted in 2023 will pay out at target if our TBVPS grows at an 11% annual rate over the three-year period. As noted above, the resulting vesting level is secondarily modified by the relative TSR modifier. Earned awards can increase from 1% to 25% if TSR is greater than the 65th percentile of the Performance Peer Group, or decrease from 1% to 25% if TSR is less than the 35th percentile of the Performance Peer Group. Awards are not modified if TSR performance is between the 35th and 65th percentiles. The maximum number of shares that can be earned is 200% of target. The table below sets forth the threshold, target and maximum performance levels for TBVPS:
The Compensation and Human Capital Committee sets award targets for long-term incentive compensation for our NEOs based, in part, on Compensation Peer Group analysis and extensive review of competitive benchmarking data. For 2023, the Compensation and Human Capital Committee increased the long-term incentive grant for the NEOs by approximately 15% above the target award value in recognition of the Company’s outstanding performance in 2022. The target value of the award and the actual grant value stated as a percentage of base salary, are summarized in the table below:
2023 Compensation Decisions for Named Executive Officers 2023 Short-Term Cash Incentive Plan Payout The group financial performance metrics represent the weighted average results under the plan formula for the insurance, reinsurance, mortgage and investment The level of goal achievement for the Short-Term Cash Incentive The strategic performance results, which 2021 Performance Shares Plan Payout As stated above, the Company uses performance shares as The starting TBVPS for the 2021 grants was $28.63. At the end of 2023, the TBVPS grew to $44.99, a 16.26% annualized increase over the performance period, resulting in a payout Based on Arch Capital’s TSR over the three‐year performance period of
Based on the two calculations above, the indicated final payout was 200.0% for the
2024 Long-Term Incentive Awards In February 2024, and as will be described in more detail in the 2025 Proxy Statement, the Company made annual cycle long-term incentive grants in the form of performance shares, stock options and time-based restricted stock to the NEOs. The Compensation and Human Capital Committee sets award targets for long-term incentive compensation for our NEOs based, in part, on Compensation Peer Group analysis, extensive review of competitive benchmarking data and an evaluation of performance. As discussed in “2023 Compensation Decisions for NEOs,” the Compensation and Human Capital Committee increased the long-term incentive target for the NEOs. For the 2024 annual cycle grants, each of the NEOs received the following:
1 Similar to the annual cycle long-term incentive awards granted in 2023 and, as described in “2023 Compensation Decisions for NEOs,” the Company granted 55% in performance shares (measured by economic value), 25% in stock options and 20% in time-based restricted shares in February 2024. 2 Messrs. Grandisson, Morin, Papadopoulo, Rajeh and Gansberg’s February 2024 grant increased as a result of their January 1, 2024 base salary and long-term incentive target change, as described in “2023 Compensation Decisions for NEOs.”
Nicolas Papadopoulo | |||||||||||||||||||||||||||||||||||||||||||||||||||||||||||||||||||||||||||||||||||||||||||||||||||||||||||||||||||||||||||||||||||||||||||||||||||||||||||||||||||||||||||||||||||||||||||||||||||||||||||||||||||||||||||||||||||||||||||||||||||||||||||||||||||||||||||||||||||||||||||||||||||||||||||||||||||||||||||||||||||||||||||||||||||||||||||||||||||||||||||||||||||||||||||||||||||||||||||||||||||||||||||||||||||||||||||||||||||||||||||||||||||||||||||||||||||||||||||||||||||||||||||||||||||||||||||||||||||||||||||||||||||||||||||||||||||||||||||||||||||||||||||||||||||||||||||||||||||||||||||||||||||||||||||||||||||||||||||||||||||||||||||||||||||||||||||||||||||||||||||||||||||||||||||||||||||||||||||||||||||||||||||||||||||||||||||||||||||||||||||||||||||||||||||||||||||||||||||||||||||||||||||||||||||||||||||||||||||||||||||||||||||||||||||||||||||||||||||||||||||||||||||||||||||||||||||||||||||||||||||||||||||||||||||||||||||||||||||||||||||||||||||||||||||||||||||||||||||||||
| Strategic Goals | |||||||||||||||||||||||||||||||||||||||||||||||||||||||||||||||||||||||||||||||||||||||||||||||||||||||||||||||||||||||||||||||||||||||||||||||||||||||||||||||||||||||||||||||||||||||||||||||||||||||||||||||||||||||||||||||||||||||||||||||||||||||||||||||||||||||||||||||||||||||||||||||||||||||||||||||||||||||||||||||||||||||||||||||||||||||||||||||||||||||||||||||||||||||||||||||||||||||||||||||||||||||||||||||||||||||||||||||||||||||||||||||||||||||||||||||||||||||||||||||||||||||||||||||||||||||||||||||||||||||||||||||||||||||||||||||||||||||||||||||||||||||||||||||||||||||||||||||||||||||||||||||||||||||||||||||||||||||||||||||||||||||||||||||||||||||||||||||||||||||||||||||||||||||||||||||||||||||||||||||||||||||||||||||||||||||||||||||||||||||||||||||||||||||||||||||||||||||||||||||||||||||||||||||||||||||||||||||||||||||||||||||||||||||||||||||||||||||||||||||||||||||||||||||||||||||||||||||||||||||||||||||||||||||||||||||||||||||||||||||||||||||||||||||||||||||||||||||||||||||
Mr. Papadopoulo’s strategic goals included growth strategies, strategic initiatives, leadership development, and D&I initiatives. Mr. Papadopoulo continues to build alignment and common strategies around future growth for | |||||||||||||||||||||||||||||||||||||||||||||||||||||||||||||||||||||||||||||||||||||||||||||||||||||||||||||||||||||||||||||||||||||||||||||||||||||||||||||||||||||||||||||||||||||||||||||||||||||||||||||||||||||||||||||||||||||||||||||||||||||||||||||||||||||||||||||||||||||||||||||||||||||||||||||||||||||||||||||||||||||||||||||||||||||||||||||||||||||||||||||||||||||||||||||||||||||||||||||||||||||||||||||||||||||||||||||||||||||||||||||||||||||||||||||||||||||||||||||||||||||||||||||||||||||||||||||||||||||||||||||||||||||||||||||||||||||||||||||||||||||||||||||||||||||||||||||||||||||||||||||||||||||||||||||||||||||||||||||||||||||||||||||||||||||||||||||||||||||||||||||||||||||||||||||||||||||||||||||||||||||||||||||||||||||||||||||||||||||||||||||||||||||||||||||||||||||||||||||||||||||||||||||||||||||||||||||||||||||||||||||||||||||||||||||||||||||||||||||||||||||||||||||||||||||||||||||||||||||||||||||||||||||||||||||||||||||||||||||||||||||||||||||||||||||||||||||||||||||||
| Compensation Decisions | |||||||||||||||||||||||||||||||||||||||||||||||||||||||||||||||||||||||||||||||||||||||||||||||||||||||||||||||||||||||||||||||||||||||||||||||||||||||||||||||||||||||||||||||||||||||||||||||||||||||||||||||||||||||||||||||||||||||||||||||||||||||||||||||||||||||||||||||||||||||||||||||||||||||||||||||||||||||||||||||||||||||||||||||||||||||||||||||||||||||||||||||||||||||||||||||||||||||||||||||||||||||||||||||||||||||||||||||||||||||||||||||||||||||||||||||||||||||||||||||||||||||||||||||||||||||||||||||||||||||||||||||||||||||||||||||||||||||||||||||||||||||||||||||||||||||||||||||||||||||||||||||||||||||||||||||||||||||||||||||||||||||||||||||||||||||||||||||||||||||||||||||||||||||||||||||||||||||||||||||||||||||||||||||||||||||||||||||||||||||||||||||||||||||||||||||||||||||||||||||||||||||||||||||||||||||||||||||||||||||||||||||||||||||||||||||||||||||||||||||||||||||||||||||||||||||||||||||||||||||||||||||||||||||||||||||||||||||||||||||||||||||||||||||||||||||||||||||||||||||
■Base Salary | Mr. Papadopoulo’s base salary | ||||||||||||||||||||||||||||||||||||||||||||||||||||||||||||||||||||||||||||||||||||||||||||||||||||||||||||||||||||||||||||||||||||||||||||||||||||||||||||||||||||||||||||||||||||||||||||||||||||||||||||||||||||||||||||||||||||||||||||||||||||||||||||||||||||||||||||||||||||||||||||||||||||||||||||||||||||||||||||||||||||||||||||||||||||||||||||||||||||||||||||||||||||||||||||||||||||||||||||||||||||||||||||||||||||||||||||||||||||||||||||||||||||||||||||||||||||||||||||||||||||||||||||||||||||||||||||||||||||||||||||||||||||||||||||||||||||||||||||||||||||||||||||||||||||||||||||||||||||||||||||||||||||||||||||||||||||||||||||||||||||||||||||||||||||||||||||||||||||||||||||||||||||||||||||||||||||||||||||||||||||||||||||||||||||||||||||||||||||||||||||||||||||||||||||||||||||||||||||||||||||||||||||||||||||||||||||||||||||||||||||||||||||||||||||||||||||||||||||||||||||||||||||||||||||||||||||||||||||||||||||||||||||||||||||||||||||||||||||||||||||||||||||||||||||||||||||||||||||||
■Short-Term Cash Incentive | The Compensation and
| ||||||||||||||||||||||||||||||||||||||||||||||||||||||||||||||||||||||||||||||||||||||||||||||||||||||||||||||||||||||||||||||||||||||||||||||||||||||||||||||||||||||||||||||||||||||||||||||||||||||||||||||||||||||||||||||||||||||||||||||||||||||||||||||||||||||||||||||||||||||||||||||||||||||||||||||||||||||||||||||||||||||||||||||||||||||||||||||||||||||||||||||||||||||||||||||||||||||||||||||||||||||||||||||||||||||||||||||||||||||||||||||||||||||||||||||||||||||||||||||||||||||||||||||||||||||||||||||||||||||||||||||||||||||||||||||||||||||||||||||||||||||||||||||||||||||||||||||||||||||||||||||||||||||||||||||||||||||||||||||||||||||||||||||||||||||||||||||||||||||||||||||||||||||||||||||||||||||||||||||||||||||||||||||||||||||||||||||||||||||||||||||||||||||||||||||||||||||||||||||||||||||||||||||||||||||||||||||||||||||||||||||||||||||||||||||||||||||||||||||||||||||||||||||||||||||||||||||||||||||||||||||||||||||||||||||||||||||||||||||||||||||||||||||||||||||||||||||||||||||
| 2023 STI Metric | Payout Factor | x Weighting | = Adjusted Weighting | x Target Bonus | = Bonus Payout (Max 2x) | ||||||||||||||||||||||||||||||||||||||||||||||||||||||||||||||||||||||||||||||||||||||||||||||||||||||||||||||||||||||||||||||||||||||||||||||||||||||||||||||||||||||||||||||||||||||||||||||||||||||||||||||||||||||||||||||||||||||||||||||||||||||||||||||||||||||||||||||||||||||||||||||||||||||||||||||||||||||||||||||||||||||||||||||||||||||||||||||||||||||||||||||||||||||||||||||||||||||||||||||||||||||||||||||||||||||||||||||||||||||||||||||||||||||||||||||||||||||||||||||||||||||||||||||||||||||||||||||||||||||||||||||||||||||||||||||||||||||||||||||||||||||||||||||||||||||||||||||||||||||||||||||||||||||||||||||||||||||||||||||||||||||||||||||||||||||||||||||||||||||||||||||||||||||||||||||||||||||||||||||||||||||||||||||||||||||||||||||||||||||||||||||||||||||||||||||||||||||||||||||||||||||||||||||||||||||||||||||||||||||||||||||||||||||||||||||||||||||||||||||||||||||||||||||||||||||||||||||||||||||||||||||||||||||||||||||||||||||||||||||||||||||||||||||||||||||||||||||||||
| Financial Performance—Group | 200% | 50% | 100% | $1,402,500 | $1,402,500 | ||||||||||||||||||||||||||||||||||||||||||||||||||||||||||||||||||||||||||||||||||||||||||||||||||||||||||||||||||||||||||||||||||||||||||||||||||||||||||||||||||||||||||||||||||||||||||||||||||||||||||||||||||||||||||||||||||||||||||||||||||||||||||||||||||||||||||||||||||||||||||||||||||||||||||||||||||||||||||||||||||||||||||||||||||||||||||||||||||||||||||||||||||||||||||||||||||||||||||||||||||||||||||||||||||||||||||||||||||||||||||||||||||||||||||||||||||||||||||||||||||||||||||||||||||||||||||||||||||||||||||||||||||||||||||||||||||||||||||||||||||||||||||||||||||||||||||||||||||||||||||||||||||||||||||||||||||||||||||||||||||||||||||||||||||||||||||||||||||||||||||||||||||||||||||||||||||||||||||||||||||||||||||||||||||||||||||||||||||||||||||||||||||||||||||||||||||||||||||||||||||||||||||||||||||||||||||||||||||||||||||||||||||||||||||||||||||||||||||||||||||||||||||||||||||||||||||||||||||||||||||||||||||||||||||||||||||||||||||||||||||||||||||||||||||||||||||||||||||
| Financial Performance—Segment | 164% | 20% | 32.8% | 460,020 | |||||||||||||||||||||||||||||||||||||||||||||||||||||||||||||||||||||||||||||||||||||||||||||||||||||||||||||||||||||||||||||||||||||||||||||||||||||||||||||||||||||||||||||||||||||||||||||||||||||||||||||||||||||||||||||||||||||||||||||||||||||||||||||||||||||||||||||||||||||||||||||||||||||||||||||||||||||||||||||||||||||||||||||||||||||||||||||||||||||||||||||||||||||||||||||||||||||||||||||||||||||||||||||||||||||||||||||||||||||||||||||||||||||||||||||||||||||||||||||||||||||||||||||||||||||||||||||||||||||||||||||||||||||||||||||||||||||||||||||||||||||||||||||||||||||||||||||||||||||||||||||||||||||||||||||||||||||||||||||||||||||||||||||||||||||||||||||||||||||||||||||||||||||||||||||||||||||||||||||||||||||||||||||||||||||||||||||||||||||||||||||||||||||||||||||||||||||||||||||||||||||||||||||||||||||||||||||||||||||||||||||||||||||||||||||||||||||||||||||||||||||||||||||||||||||||||||||||||||||||||||||||||||||||||||||||||||||||||||||||||||||||||||||||||||||||||||||||||||
| Strategic Performance | 225% | 30% | 67.5% | 942,480 | |||||||||||||||||||||||||||||||||||||||||||||||||||||||||||||||||||||||||||||||||||||||||||||||||||||||||||||||||||||||||||||||||||||||||||||||||||||||||||||||||||||||||||||||||||||||||||||||||||||||||||||||||||||||||||||||||||||||||||||||||||||||||||||||||||||||||||||||||||||||||||||||||||||||||||||||||||||||||||||||||||||||||||||||||||||||||||||||||||||||||||||||||||||||||||||||||||||||||||||||||||||||||||||||||||||||||||||||||||||||||||||||||||||||||||||||||||||||||||||||||||||||||||||||||||||||||||||||||||||||||||||||||||||||||||||||||||||||||||||||||||||||||||||||||||||||||||||||||||||||||||||||||||||||||||||||||||||||||||||||||||||||||||||||||||||||||||||||||||||||||||||||||||||||||||||||||||||||||||||||||||||||||||||||||||||||||||||||||||||||||||||||||||||||||||||||||||||||||||||||||||||||||||||||||||||||||||||||||||||||||||||||||||||||||||||||||||||||||||||||||||||||||||||||||||||||||||||||||||||||||||||||||||||||||||||||||||||||||||||||||||||||||||||||||||||||||||||||||||
| TOTAL | 100% | 200.3% | $2,805,000 | ||||||||||||||||||||||||||||||||||||||||||||||||||||||||||||||||||||||||||||||||||||||||||||||||||||||||||||||||||||||||||||||||||||||||||||||||||||||||||||||||||||||||||||||||||||||||||||||||||||||||||||||||||||||||||||||||||||||||||||||||||||||||||||||||||||||||||||||||||||||||||||||||||||||||||||||||||||||||||||||||||||||||||||||||||||||||||||||||||||||||||||||||||||||||||||||||||||||||||||||||||||||||||||||||||||||||||||||||||||||||||||||||||||||||||||||||||||||||||||||||||||||||||||||||||||||||||||||||||||||||||||||||||||||||||||||||||||||||||||||||||||||||||||||||||||||||||||||||||||||||||||||||||||||||||||||||||||||||||||||||||||||||||||||||||||||||||||||||||||||||||||||||||||||||||||||||||||||||||||||||||||||||||||||||||||||||||||||||||||||||||||||||||||||||||||||||||||||||||||||||||||||||||||||||||||||||||||||||||||||||||||||||||||||||||||||||||||||||||||||||||||||||||||||||||||||||||||||||||||||||||||||||||||||||||||||||||||||||||||||||||||||||||||||||||||||||||||||||||||
| Effective January 1, 2023, Mr. Papadopoulo’s Short-Term Cash Incentive target was increased to 165% of base salary from 150% of base salary following our annual benchmarking review. For 2024 compensation decisions, Mr. Papadopoulo’s Short-Term Cash Incentive target was increased to 185% of base salary from 165% of base salary following our annual benchmarking review, effective January 1, 2024. | |||||||||||||||||||||||||||||||||||||||||||||||||||||||||||||||||||||||||||||||||||||||||||||||||||||||||||||||||||||||||||||||||||||||||||||||||||||||||||||||||||||||||||||||||||||||||||||||||||||||||||||||||||||||||||||||||||||||||||||||||||||||||||||||||||||||||||||||||||||||||||||||||||||||||||||||||||||||||||||||||||||||||||||||||||||||||||||||||||||||||||||||||||||||||||||||||||||||||||||||||||||||||||||||||||||||||||||||||||||||||||||||||||||||||||||||||||||||||||||||||||||||||||||||||||||||||||||||||||||||||||||||||||||||||||||||||||||||||||||||||||||||||||||||||||||||||||||||||||||||||||||||||||||||||||||||||||||||||||||||||||||||||||||||||||||||||||||||||||||||||||||||||||||||||||||||||||||||||||||||||||||||||||||||||||||||||||||||||||||||||||||||||||||||||||||||||||||||||||||||||||||||||||||||||||||||||||||||||||||||||||||||||||||||||||||||||||||||||||||||||||||||||||||||||||||||||||||||||||||||||||||||||||||||||||||||||||||||||||||||||||||||||||||||||||||||||||||||||||||||
■Long-Term Incentive | On February 24, 2023, the Compensation and Human Capital Committee approved the annual award summarized in the table below. The amount includes a 15% increase to the grant target in recognition of the Company’s outstanding performance in 2022. The performance shares are reflected at target since performance will be measured over the forward-looking three-year period, which will ultimately determine the number of shares earned. | ||||||||||||||||||||||||||||||||||||||||||||||||||||||||||||||||||||||||||||||||||||||||||||||||||||||||||||||||||||||||||||||||||||||||||||||||||||||||||||||||||||||||||||||||||||||||||||||||||||||||||||||||||||||||||||||||||||||||||||||||||||||||||||||||||||||||||||||||||||||||||||||||||||||||||||||||||||||||||||||||||||||||||||||||||||||||||||||||||||||||||||||||||||||||||||||||||||||||||||||||||||||||||||||||||||||||||||||||||||||||||||||||||||||||||||||||||||||||||||||||||||||||||||||||||||||||||||||||||||||||||||||||||||||||||||||||||||||||||||||||||||||||||||||||||||||||||||||||||||||||||||||||||||||||||||||||||||||||||||||||||||||||||||||||||||||||||||||||||||||||||||||||||||||||||||||||||||||||||||||||||||||||||||||||||||||||||||||||||||||||||||||||||||||||||||||||||||||||||||||||||||||||||||||||||||||||||||||||||||||||||||||||||||||||||||||||||||||||||||||||||||||||||||||||||||||||||||||||||||||||||||||||||||||||||||||||||||||||||||||||||||||||||||||||||||||||||||||||||||||
| Performance Shares | Stock Options | Time-Based Restricted Shares | |||||||||||||||||||||||||||||||||||||||||||||||||||||||||||||||||||||||||||||||||||||||||||||||||||||||||||||||||||||||||||||||||||||||||||||||||||||||||||||||||||||||||||||||||||||||||||||||||||||||||||||||||||||||||||||||||||||||||||||||||||||||||||||||||||||||||||||||||||||||||||||||||||||||||||||||||||||||||||||||||||||||||||||||||||||||||||||||||||||||||||||||||||||||||||||||||||||||||||||||||||||||||||||||||||||||||||||||||||||||||||||||||||||||||||||||||||||||||||||||||||||||||||||||||||||||||||||||||||||||||||||||||||||||||||||||||||||||||||||||||||||||||||||||||||||||||||||||||||||||||||||||||||||||||||||||||||||||||||||||||||||||||||||||||||||||||||||||||||||||||||||||||||||||||||||||||||||||||||||||||||||||||||||||||||||||||||||||||||||||||||||||||||||||||||||||||||||||||||||||||||||||||||||||||||||||||||||||||||||||||||||||||||||||||||||||||||||||||||||||||||||||||||||||||||||||||||||||||||||||||||||||||||||||||||||||||||||||||||||||||||||||||||||||||||||||||||||||||||||
| Grant Date | Number of Shares | Value1 | Number of Options | Value1 | Number of Shares | Value1 | Total | ||||||||||||||||||||||||||||||||||||||||||||||||||||||||||||||||||||||||||||||||||||||||||||||||||||||||||||||||||||||||||||||||||||||||||||||||||||||||||||||||||||||||||||||||||||||||||||||||||||||||||||||||||||||||||||||||||||||||||||||||||||||||||||||||||||||||||||||||||||||||||||||||||||||||||||||||||||||||||||||||||||||||||||||||||||||||||||||||||||||||||||||||||||||||||||||||||||||||||||||||||||||||||||||||||||||||||||||||||||||||||||||||||||||||||||||||||||||||||||||||||||||||||||||||||||||||||||||||||||||||||||||||||||||||||||||||||||||||||||||||||||||||||||||||||||||||||||||||||||||||||||||||||||||||||||||||||||||||||||||||||||||||||||||||||||||||||||||||||||||||||||||||||||||||||||||||||||||||||||||||||||||||||||||||||||||||||||||||||||||||||||||||||||||||||||||||||||||||||||||||||||||||||||||||||||||||||||||||||||||||||||||||||||||||||||||||||||||||||||||||||||||||||||||||||||||||||||||||||||||||||||||||||||||||||||||||||||||||||||||||||||||||||||||||||||||||||||||||
| Feb. 24, 2023 | 23,337 | $1,614,220 | 31,264 | $733,829 | 8,486 | $586,977 | $2,935,026 | ||||||||||||||||||||||||||||||||||||||||||||||||||||||||||||||||||||||||||||||||||||||||||||||||||||||||||||||||||||||||||||||||||||||||||||||||||||||||||||||||||||||||||||||||||||||||||||||||||||||||||||||||||||||||||||||||||||||||||||||||||||||||||||||||||||||||||||||||||||||||||||||||||||||||||||||||||||||||||||||||||||||||||||||||||||||||||||||||||||||||||||||||||||||||||||||||||||||||||||||||||||||||||||||||||||||||||||||||||||||||||||||||||||||||||||||||||||||||||||||||||||||||||||||||||||||||||||||||||||||||||||||||||||||||||||||||||||||||||||||||||||||||||||||||||||||||||||||||||||||||||||||||||||||||||||||||||||||||||||||||||||||||||||||||||||||||||||||||||||||||||||||||||||||||||||||||||||||||||||||||||||||||||||||||||||||||||||||||||||||||||||||||||||||||||||||||||||||||||||||||||||||||||||||||||||||||||||||||||||||||||||||||||||||||||||||||||||||||||||||||||||||||||||||||||||||||||||||||||||||||||||||||||||||||||||||||||||||||||||||||||||||||||||||||||||||||||||||||
■2021 Perfor-mance Share Cycle Vesting | The starting TBVPS for the 2021 grants was $28.63. At the end of 2023, TBVPS grew to $44.99, a 16.26% annualized increase over the performance period, resulting in a payout percentage of 200%, based on TBVPS growth. Based on Arch Capital’s TSR over the three-year performance period of 122.9%, which placed it in the 100th percentile of our Performance Peer Group, the resulting TSR multiplier was 125.0%, and the overall payout factor was calculated at 200.0%, which was the maximum payout. | ||||||||||||||||||||||||||||||||||||||||||||||||||||||||||||||||||||||||||||||||||||||||||||||||||||||||||||||||||||||||||||||||||||||||||||||||||||||||||||||||||||||||||||||||||||||||||||||||||||||||||||||||||||||||||||||||||||||||||||||||||||||||||||||||||||||||||||||||||||||||||||||||||||||||||||||||||||||||||||||||||||||||||||||||||||||||||||||||||||||||||||||||||||||||||||||||||||||||||||||||||||||||||||||||||||||||||||||||||||||||||||||||||||||||||||||||||||||||||||||||||||||||||||||||||||||||||||||||||||||||||||||||||||||||||||||||||||||||||||||||||||||||||||||||||||||||||||||||||||||||||||||||||||||||||||||||||||||||||||||||||||||||||||||||||||||||||||||||||||||||||||||||||||||||||||||||||||||||||||||||||||||||||||||||||||||||||||||||||||||||||||||||||||||||||||||||||||||||||||||||||||||||||||||||||||||||||||||||||||||||||||||||||||||||||||||||||||||||||||||||||||||||||||||||||||||||||||||||||||||||||||||||||||||||||||||||||||||||||||||||||||||||||||||||||||||||||||||||||||||
| 2021 Grant (Target) | Approved Payout Factor | Total Vested | Adjustment to Target Shares Awarded | Value of Adjustment to Target Shares at 12/31/20232 | |||||||||||||||||||||||||||||||||||||||||||||||||||||||||||||||||||||||||||||||||||||||||||||||||||||||||||||||||||||||||||||||||||||||||||||||||||||||||||||||||||||||||||||||||||||||||||||||||||||||||||||||||||||||||||||||||||||||||||||||||||||||||||||||||||||||||||||||||||||||||||||||||||||||||||||||||||||||||||||||||||||||||||||||||||||||||||||||||||||||||||||||||||||||||||||||||||||||||||||||||||||||||||||||||||||||||||||||||||||||||||||||||||||||||||||||||||||||||||||||||||||||||||||||||||||||||||||||||||||||||||||||||||||||||||||||||||||||||||||||||||||||||||||||||||||||||||||||||||||||||||||||||||||||||||||||||||||||||||||||||||||||||||||||||||||||||||||||||||||||||||||||||||||||||||||||||||||||||||||||||||||||||||||||||||||||||||||||||||||||||||||||||||||||||||||||||||||||||||||||||||||||||||||||||||||||||||||||||||||||||||||||||||||||||||||||||||||||||||||||||||||||||||||||||||||||||||||||||||||||||||||||||||||||||||||||||||||||||||||||||||||||||||||||||||||||||||||||||||
| 36,851 | 200.0% | 73,702 | 36,851 | $2,736,924 | |||||||||||||||||||||||||||||||||||||||||||||||||||||||||||||||||||||||||||||||||||||||||||||||||||||||||||||||||||||||||||||||||||||||||||||||||||||||||||||||||||||||||||||||||||||||||||||||||||||||||||||||||||||||||||||||||||||||||||||||||||||||||||||||||||||||||||||||||||||||||||||||||||||||||||||||||||||||||||||||||||||||||||||||||||||||||||||||||||||||||||||||||||||||||||||||||||||||||||||||||||||||||||||||||||||||||||||||||||||||||||||||||||||||||||||||||||||||||||||||||||||||||||||||||||||||||||||||||||||||||||||||||||||||||||||||||||||||||||||||||||||||||||||||||||||||||||||||||||||||||||||||||||||||||||||||||||||||||||||||||||||||||||||||||||||||||||||||||||||||||||||||||||||||||||||||||||||||||||||||||||||||||||||||||||||||||||||||||||||||||||||||||||||||||||||||||||||||||||||||||||||||||||||||||||||||||||||||||||||||||||||||||||||||||||||||||||||||||||||||||||||||||||||||||||||||||||||||||||||||||||||||||||||||||||||||||||||||||||||||||||||||||||||||||||||||||||||||||||
1 The total long-term incentive value provided in the summary above for performance share awards differs from the grant date fair value reported in the “2023 Summary Compensation” and “2023 Grants of Plan-Based Awards” Tables. The values in the summary above were based on the closing price of our shares on the grant date and the target number of
2 The Value of Adjustment to Target Shares is | |||||||||||||||||||||||||||||||||||||||||||||||||||||||||||||||||||||||||||||||||||||||||||||||||||||||||||||||||||||||||||||||||||||||||||||||||||||||||||||||||||||||||||||||||||||||||||||||||||||||||||||||||||||||||||||||||||||||||||||||||||||||||||||||||||||||||||||||||||||||||||||||||||||||||||||||||||||||||||||||||||||||||||||||||||||||||||||||||||||||||||||||||||||||||||||||||||||||||||||||||||||||||||||||||||||||||||||||||||||||||||||||||||||||||||||||||||||||||||||||||||||||||||||||||||||||||||||||||||||||||||||||||||||||||||||||||||||||||||||||||||||||||||||||||||||||||||||||||||||||||||||||||||||||||||||||||||||||||||||||||||||||||||||||||||||||||||||||||||||||||||||||||||||||||||||||||||||||||||||||||||||||||||||||||||||||||||||||||||||||||||||||||||||||||||||||||||||||||||||||||||||||||||||||||||||||||||||||||||||||||||||||||||||||||||||||||||||||||||||||||||||||||||||||||||||||||||||||||||||||||||||||||||||||||||||||||||||||||||||||||||||||||||||||||||||||||||||||||||||||
| 51 | | 2024 PROXY STATEMENT | | ||||||
| ||
| Reinsurance Unit Executive | ||||||||||||||||||||||||||||||||||||||||||||
Maamoun Rajeh | ||||||||||||||||||||||||||||||||||||||||||||
| Strategic Goals | ||||||||||||||||||||||||||||||||||||||||||||
Mr. Rajeh’s strategic goals were based on reinsurance growth and profitability, strategic initiatives, leadership development, D&I and inclusion initiatives and enhancing the
| ||||||||||||||||||||||||||||||||||||||||||||
| Compensation Decisions | ||||||||||||||||||||||||||||||||||||||||||||
■ Base Salary | Mr. Rajeh’s | |||||||||||||||||||||||||||||||||||||||||||
■ Short-Term Cash Incentive | The Compensation and Human Capital Committee reviewed Mr. Rajeh’s performance against his strategic goals, which resulted in a payout factor of 200% on the | |||||||||||||||||||||||||||||||||||||||||||
| 2023 STI Metric | Payout Factor | x Weighting | = Adjusted Weighting | x Target Bonus | = Bonus Payout (Max 2x) | |||||||||||||||||||||||||||||||||||||||
| Financial Performance—Group | 200% | 20% | 40% | $1,092,000 | $436,800 | |||||||||||||||||||||||||||||||||||||||
Financial Performance—Segment1 | 181.6% | 50% | 90.8% | 991,500 | ||||||||||||||||||||||||||||||||||||||||
| Strategic Performance | 200% | 30% | 60% | 655,200 | ||||||||||||||||||||||||||||||||||||||||
| TOTAL | 100% | 190.8% | $2,083,500 | |||||||||||||||||||||||||||||||||||||||||
1 The payout factor was reduced for amounts calculated under the reinsurance segment’s formula approach under the short-term cash incentive plan attributable to performance for prior underwriting years, for which Mr. Rajeh has previously received payment. | ||||||||||||||||||||||||||||||||||||||||||||
| Effective January 1, 2023, Mr. Rajeh’s Short-Term Cash Incentive target was increased to 140% of base salary from 135% of base salary following our annual benchmarking review. For 2024 compensation decisions, Mr. Rajeh’s Short-Term Cash Incentive target was increased to 165% of base salary from 140% of base salary following our annual benchmarking review, effective January 1, 2024. | ||||||||||||||||||||||||||||||||||||||||||||
■Long-Term Incentive | On February 24, 2023, the Compensation and Human Capital Committee approved the annual award summarized in the table below. The amount includes a 15% increase to the grant target in recognition of the Company’s outstanding performance in 2022. The performance shares are reflected at target since performance will be measured over the forward-looking three-year period, which will ultimately determine the number of | |||||||||||||||||||||||||||||||||||||||||||
| Performance Shares | Stock Options | Time-Based Restricted Shares | ||||||||||||||||||||||||||||||||||||||||||
| Grant Date | Number of Shares | Value1 | Number of Options | Value1 | Number of Shares | Value1 | Total | |||||||||||||||||||||||||||||||||||||
| Feb. 24, 2023 | 14,273 | $987,263 | 19,121 | $448,808 | 5,190 | $358,992 | $1,795,063 | |||||||||||||||||||||||||||||||||||||
■2021 Perfor-mance Share Cycle Vesting | The starting TBVPS for the | |||||||||||||||||||||||||||||||||||||||||||
| 2021 Grant (Target) | Approved Payout Factor | Total Vested | Adjustment to Target Shares Awarded | Value of Adjustment to Target Shares at 12/31/20232 | ||||||||||||||||||||||||||||||||||||||||
| 22,264 | 200.0% | 44,528 | 22,264 | $1,653,547 | ||||||||||||||||||||||||||||||||||||||||
2 The Value of Adjustment to Target Shares is | ||||||||||||||||||||||||||||||||||||||||||||
| 2024 PROXY STATEMENT | | 52 | ||||||
| Mortgage Unit Executive | ||||||||||||||||||||||||||
David E. Gansberg Chief Executive Officer, Global Mortgage Group | ||||||||||||||||||||||||||
| Strategic Goals | ||||||||||||||||||||||||||
| Mr. Gansberg’s strategic goals were based on growth and diversification, strategic initiatives, leadership development, and D&I initiatives. Under Mr. Gansberg’s leadership, the Mortgage group earned $1.1 billion of underwriting income in a challenging year due to industry-wide reductions in mortgage originations. Also, the group generated significant financial benefit from calling several outstanding notes that no longer provided capital benefit. The Compensation and Human Capital Committee also evaluated Mr. Gansberg’s oversight of strategic initiatives including international growth in Australia and growth in gross written premium of 80% over 2022 from European Significant Risk Transfer transactions. Under Mr. Gansberg’s guidance, the group continues to enhance analytics by building better real-time analytics on housing industry and economic trends and competitor pricing. The group is diversifying business beyond primary mortgage insurance by operationalizing second lien insurance business and restarting the whole loan acquisition business. Mr. Gansberg continues to support the development and coaching of his leadership team and under his direction, the Mortgage group was named one of the Best Places To Work for the fifth consecutive year by Triad Business Journal. | ||||||||||||||||||||||||||
| Compensation Decisions | ||||||||||||||||||||||||||
■ Base Salary | Mr. Gansberg’s base salary was increased to $780,000 from $725,000 in January 2023 following our annual benchmarking review, company growth and continued high performance. For 2024 compensation decisions, Mr. Gansberg’s base salary was increased to $850,000 from $780,000 following our annual benchmarking review, effective January 1, 2024. | |||||||||||||||||||||||||
■ Short-Term Cash Incentive | The Compensation and Human Capital Committee reviewed Mr. Gansberg’s performance against his strategic goals, which resulted in a payout factor of 200% on the portion of his bonus that was based on strategic performance. | |||||||||||||||||||||||||
| 2023 STI Metric | Payout Factor | x Weighting | = Adjusted Weighting | x Target Bonus | = Bonus Payout (Max 2x) | |||||||||||||||||||||
| Financial Performance—Group | 200% | 20% | 40% | $1,092,000 | $436,800 | |||||||||||||||||||||
Financial Performance—Segment1 | 179.2% | 50% | 90% | 978,481 | ||||||||||||||||||||||
| Strategic Performance | 200% | 30% | 60% | 655,200 | ||||||||||||||||||||||
| TOTAL | 100% | 190% | $2,070,481 | |||||||||||||||||||||||
1 The payout factor was reduced for amounts calculated under the mortgage segment’s formula approach under the short-term cash incentive plan attributable to performance for prior underwriting years in recognition of the fact that an additional bonus amount of $97,219 was paid to Mr. Gansberg in March 2024 for those prior underwriting years due to his continued participation in the Mortgage segment’s separate formulaic bonus plan for those prior years. | ||||||||||||||||||||||||||
| Effective January 1, 2023, Mr. Gansberg’s Short-Term Cash Incentive target was increased to 140% of base salary from 135% of base salary following our annual benchmarking review. For 2024 compensation decisions, Mr. Gansberg’s Short-Term Cash Incentive target was increased to 165% of base salary from 140% of base salary following our annual benchmarking review, effective January 1, 2024. | ||||||||||||||||||||||||||
■ Long-Term Incentive | On February 24, 2023, the Compensation and Human Capital Committee approved the annual award summarized in the table below. The amount includes a 15% increase to the grant target in recognition of the Company’s outstanding performance in 2022. The performance shares are reflected at target since performance will be measured over the forward-looking three-year period, which will ultimately determine the number of shares earned. | |||||||||||||||||||||||||
| Performance Shares | Stock Options | Time-Based Restricted Shares | ||||||||||||||||||||||||
| Grant Date | Number of Shares | Value1 | Number of Options | Value1 | Number of Shares | Value1 | Total | |||||||||||||||||||
| Feb. 24, 2023 | 14,273 | $987,263 | 19,121 | $448,808 | 5,190 | $358,992 | $1,795,063 | |||||||||||||||||||
■ 2021 Perfor-mance Share Cycle Vesting | The starting TBVPS for the 2021 grants was $28.63. At the end of 2023, TBVPS grew to $44.99, a 16.26% annualized increase over the performance period, resulting in a payout percentage of 200%, based on TBVPS growth. Based on Arch Capital’s TSR over the three-year performance period of 122.9%, which placed it in the 100th percentile of our Performance Peer Group, the resulting TSR multiplier was 125.0%, and the overall payout factor was calculated at 200.0%, which was the maximum payout. | |||||||||||||||||||||||||
| 2021 Grant (Target) | Approved Payout Factor | Total Vested | Adjustment to Target Shares Awarded | Value of Adjustment to Target Shares at 12/31/20232 | ||||||||||||||||||||||
| 22,264 | 200.0% | 44,528 | 22,264 | $1,653,547 | ||||||||||||||||||||||
1 The total long-term incentive value provided in the summary above for performance share awards differs from the grant date fair value reported in the “2023 Summary Compensation” and “2023 Grants of Plan-Based Awards” Tables. The values in the summary above were based on the closing price of our shares on the grant date and the target number of shares. The values in the “2023 Summary Compensation” and “2023 Grants of Plan-Based Awards” Tables were computed at the grant date in accordance with ASC Topic 718. Stock options are valued on the grant date based on the Black-Scholes option pricing methodology (refer to “Elements of Compensation Program—Long-Term Incentive Plan”) and restricted shares are valued based on the closing price of our common shares on the grant date. 2 The Value of Adjustment to Target Shares is calculated utilizing the December 31, 2023 closing stock price of Arch Capital, which was $74.27. | ||||||||||||||||||||||||||
| 53 | | 2024 PROXY STATEMENT | | ||||||
| Name | 2024 Target (% of Base Salary) | February 2024 Annual Cycle Grants1 | |||||||||
Marc Grandisson2 | 560% | $7,280,000 | |||||||||
François Morin2 | 230% | $1,840,000 | |||||||||
Nicolas Papadopoulo2 | 380% | $3,420,000 | |||||||||
Maamoun Rajeh2 | 300% | $2,550,000 | |||||||||
David E. Gansberg2 | 300% | $2,550,000 | |||||||||
| 2024 PROXY STATEMENT | | 54 | ||||||
| 55 | | 2024 PROXY STATEMENT | | ||||||
| COMPENSATION AND HUMAN CAPITAL COMMITTEE Moira Kilcoyne (Chair) (as of Eric W. Doppstadt Francis Ebong Louis J. Paglia Brian S. Posner (as of Eugene S. Sunshine | ||||||||
| 2024 PROXY STATEMENT | | 56 | ||||||
| 2023 Summary Compensation Table | ||||||||||||||
| Name and Principal Position | Year | Salary ($)(1) | Annual Bonus ($) | Stock Awards ($)(2) | Option Awards ($)(3) | Non-Equity Incentive Plan Compensation ($)(4) | All Other Compensation ($)(5) | Total ($) | ||||||||||||||||||||||||||||||||||||||||||||||||||||||
| Marc Grandisson | 2023 | 1,225,000 | — | 4,972,757 | 1,578,304 | 4,900,000 | 426,191 | 13,102,252 | ||||||||||||||||||||||||||||||||||||||||||||||||||||||
| Chief Executive Officer and Class III Director, Arch Capital | 2022 | 1,225,000 | — | 4,285,510 | 1,378,188 | 4,745,700 | 467,241 | 12,101,639 | ||||||||||||||||||||||||||||||||||||||||||||||||||||||
| 2021 | 1,000,000 | — | 3,482,784 | 1,125,018 | 3,300,000 | 428,211 | 9,336,013 | |||||||||||||||||||||||||||||||||||||||||||||||||||||||
| François Morin | 2023 | 750,000 | — | 1,358,907 | 431,298 | 2,100,000 | (6) | 316,372 | 4,956,577 | |||||||||||||||||||||||||||||||||||||||||||||||||||||
| Executive Vice President, Chief Financial Officer and Treasurer, Arch Capital | 2022 | 675,000 | — | 1,049,474 | 337,509 | 1,822,500 | (6) | 326,227 | 4,210,710 | |||||||||||||||||||||||||||||||||||||||||||||||||||||
| 2021 | 675,000 | — | 1,044,861 | 337,504 | 1,822,500 | (6) | 298,034 | 4,177,899 | ||||||||||||||||||||||||||||||||||||||||||||||||||||||
| Nicolas Papadopoulo | 2023 | 850,000 | — | 2,312,048 | 733,829 | 2,805,000 | 441,658 | (7) | 7,142,535 | |||||||||||||||||||||||||||||||||||||||||||||||||||||
| President and Chief Underwriting Officer, Arch Capital and CEO, Arch Worldwide Insurance Group | 2022 | 800,000 | — | 1,865,812 | 600,026 | 2,256,500 | 433,889 | (7) | 5,956,227 | |||||||||||||||||||||||||||||||||||||||||||||||||||||
| 2021 | 800,000 | — | 1,857,478 | 600,008 | 2,192,600 | 450,812 | (7) | 5,900,898 | ||||||||||||||||||||||||||||||||||||||||||||||||||||||
| Maamoun Rajeh | 2023 | 780,000 | 1,414,052 | 448,808 | 2,083,500 | (9) | 546,343 | 5,272,703 | ||||||||||||||||||||||||||||||||||||||||||||||||||||||
| Chairman and Chief Executive Officer, Arch Worldwide Reinsurance Group | 2022 | 725,000 | 1,127,234 | 362,510 | 1,431,400 | 547,379 | 4,193,523 | |||||||||||||||||||||||||||||||||||||||||||||||||||||||
| 2021 | 725,000 | 3,600,451 | (8) | 1,122,227 | 362,506 | 1,548,400 | 560,148 | 7,918,732 | ||||||||||||||||||||||||||||||||||||||||||||||||||||||
| David E. Gansberg | 2023 | 780,000 | 97,219 | (10) | 1,414,052 | 448,808 | 2,070,481 | 198,934 | (7) | 5,009,494 | ||||||||||||||||||||||||||||||||||||||||||||||||||||
| Chief Executive Officer, Global Mortgage Group, Arch Capital | 2022 | 725,000 | 266,321 | (10) | 1,127,234 | 362,510 | 1,608,079 | 184,139 | (7) | 4,273,283 | ||||||||||||||||||||||||||||||||||||||||||||||||||||
| 2021 | 725,000 | 398,000 | (10) | 1,122,227 | 362,506 | 1,513,200 | 110,671 | (7) | 4,231,604 | |||||||||||||||||||||||||||||||||||||||||||||||||||||
| 57 | | 2024 PROXY STATEMENT | | ||||||
| Name | Housing Allowance (Bermuda)($) | Retirement Plans ($)(a) | Social Insurance ($)(b) | Other ($)(c) | ||||||||||
| Marc Grandisson | 224,778 | 149,775 | 1,868 | — | ||||||||||
| François Morin | 85,745 | 100,740 | 1,868 | 75,000 | ||||||||||
| Nicolas Papadopoulo | 222,548 | 95,400 | 1,868 | — | ||||||||||
| Maamoun Rajeh | 209,396 | 105,090 | 1,868 | 140,000 | ||||||||||
| David E. Gansberg | — | 84,840 | — | 67,778 | ||||||||||
| Marc Grandisson | François Morin | Nicolas Papadopoulo | Maamoun Rajeh | David E. Gansberg | |||||||||||||
| Automobile Allowance | Y | Y | Y | ||||||||||||||
| Cell Allowance | Y | ||||||||||||||||
| Club Dues | Y | Y | Y | Y | |||||||||||||
| Family Travel | Y | Y | Y | Y | |||||||||||||
| Life Insurance and LTD | Y | Y | Y | Y | |||||||||||||
| Fees for Children Schooling | Y | ||||||||||||||||
| Tax Preparation Services | Y | Y | Y | Y | |||||||||||||
| 2024 PROXY STATEMENT | | 58 | ||||||
| 2023 | Grants of Plan-Based Awards | ||||||||||||||||
| Estimated Future Payouts Under Non-Equity Incentive Plan Awards ($)(2) | Estimated Future Payouts Under Equity Incentive Plan Awards ($)(3) | All Other Stock Awards: Number of Shares of Stock or Units (#)(4) | All Other Option Awards: Number of Securities Underlying Options (#)(5) | Exercise or Base Price of Option Awards ($/Sh)(5) | Grant Date Fair Value of Stock and Option Awards ($)(6) | ||||||||||||||||||||||||||||||||||||
| Name | Grant Date (1) | Threshold | Target | Maximum | Threshold | Target | Maximum | ||||||||||||||||||||||||||||||||||
| Marc Grandisson | 2/24/2023 | 25,097 | 50,193 | 100,386 | 73.92 | 3,710,267 | |||||||||||||||||||||||||||||||||||
| 2/24/2023 | 18,252 | 69.17 | 1,262,491 | ||||||||||||||||||||||||||||||||||||||
| 2/24/2023 | 67,242 | 69.17 | 1,578,304 | ||||||||||||||||||||||||||||||||||||||
| NA | 490,000 | 2,450,000 | 4,900,000 | ||||||||||||||||||||||||||||||||||||||
| François Morin (7) | 2/24/2023 | 6,858 | 13,716 | 27,432 | 73.92 | 1,013,887 | |||||||||||||||||||||||||||||||||||
| 2/24/2023 | 4,988 | 69.17 | 345,020 | ||||||||||||||||||||||||||||||||||||||
| 2/24/2023 | 18,375 | 69.17 | 431,298 | ||||||||||||||||||||||||||||||||||||||
| NA | 210,000 | 1,050,000 | 2,100,000 | ||||||||||||||||||||||||||||||||||||||
| Nicolas Papadopoulo | 2/24/2023 | 11,669 | 23,337 | 46,674 | 73.92 | 1,725,071 | |||||||||||||||||||||||||||||||||||
| 2/24/2023 | 8,486 | 69.17 | 586,977 | ||||||||||||||||||||||||||||||||||||||
| 2/24/2023 | 31,264 | 69.17 | 733,829 | ||||||||||||||||||||||||||||||||||||||
| NA | 280,500 | 1,402,500 | 2,805,000 | ||||||||||||||||||||||||||||||||||||||
| Maamoun Rajeh (7) | 2/24/2023 | 7,137 | 14,273 | 28,546 | 73.92 | 1,055,060 | |||||||||||||||||||||||||||||||||||
| 2/24/2023 | 5,190 | 69.17 | 358,992 | ||||||||||||||||||||||||||||||||||||||
| 2/24/2023 | 19,121 | 69.17 | 448,808 | ||||||||||||||||||||||||||||||||||||||
| NA | 218,400 | 1,092,000 | 2,184,000 | ||||||||||||||||||||||||||||||||||||||
| David E. Gansberg | 2/24/2023 | 7,137 | 14,273 | 28,546 | 73.92 | 1,055,060 | |||||||||||||||||||||||||||||||||||
| 2/24/2023 | 5,190 | 69.17 | 358,992 | ||||||||||||||||||||||||||||||||||||||
| 2/24/2023 | 19,121 | 69.17 | 448,808 | ||||||||||||||||||||||||||||||||||||||
| NA | 218,400 | 1,092,000 | 2,184,000 | ||||||||||||||||||||||||||||||||||||||
| 59 | | 2024 PROXY STATEMENT | | ||||||
Outstanding Equity Awards at 2023Fiscal Year-End | ||||||||||||||
| Option Awards | Stock Awards | ||||||||||||||||||||||||||||||||||||||||||||||||||||
| Name | Number of Securities Underlying Unexercised Options (#) Exercisable | Number of Securities Underlying Unexercised Options (#) Unexercisable (1) | Option Exercise Price ($) | Option Expiration Date | Number of Shares or Units of Stock That Have Not Vested (#)(2) | Market Value of Shares or Units of Stock That Have Not Vested ($)(3) | Equity Incentive Plan Awards: Number of Unearned Shares, Units or Other Rights That Have Not Vested (#)(4) | Equity Incentive Plan Awards: Market or Payout Value of Unearned Shares, Units or Other Rights That Have Not Vested ($)(3) | |||||||||||||||||||||||||||||||||||||||||||||
| Marc Grandisson | 43,890 | — | 20.84 | 5/13/2025 | 180,255 | 13,387,539 | 227,936 | 16,928,807 | |||||||||||||||||||||||||||||||||||||||||||||
| 34,830 | — | 23.90 | 5/13/2026 | ||||||||||||||||||||||||||||||||||||||||||||||||||
| 69,600 | — | 32.09 | 5/8/2027 | ||||||||||||||||||||||||||||||||||||||||||||||||||
| 616,284 | — | 26.79 | 4/9/2028 | ||||||||||||||||||||||||||||||||||||||||||||||||||
| 133,821 | — | 26.55 | 5/11/2028 | ||||||||||||||||||||||||||||||||||||||||||||||||||
| 142,225 | — | 32.67 | 2/28/2029 | ||||||||||||||||||||||||||||||||||||||||||||||||||
| 138,046 | — | 42.42 | 2/27/2030 | ||||||||||||||||||||||||||||||||||||||||||||||||||
| 81,543 | 40,711 | 35.82 | 2/26/2031 | ||||||||||||||||||||||||||||||||||||||||||||||||||
| 35,055 | 69,901 | 47.54 | 2/25/2032 | ||||||||||||||||||||||||||||||||||||||||||||||||||
| — | 67,242 | 69.17 | 2/24/2033 | ||||||||||||||||||||||||||||||||||||||||||||||||||
| François Morin | 6,000 | — | 19.09 | 5/13/2024 | 52,740 | 3,917,000 | 58,668 | 4,357,272 | |||||||||||||||||||||||||||||||||||||||||||||
| 4,599 | — | 19.43 | 12/4/2024 | ||||||||||||||||||||||||||||||||||||||||||||||||||
| 11,460 | — | 20.84 | 5/13/2025 | ||||||||||||||||||||||||||||||||||||||||||||||||||
| 12,630 | — | 23.90 | 5/13/2026 | ||||||||||||||||||||||||||||||||||||||||||||||||||
| 11,010 | — | 32.09 | 5/8/2027 | ||||||||||||||||||||||||||||||||||||||||||||||||||
| 31,224 | — | 26.55 | 5/11/2028 | ||||||||||||||||||||||||||||||||||||||||||||||||||
| 27,534 | — | 29.13 | 7/24/2028 | ||||||||||||||||||||||||||||||||||||||||||||||||||
| 39,507 | — | 32.67 | 2/28/2029 | ||||||||||||||||||||||||||||||||||||||||||||||||||
| 38,346 | — | 42.42 | 2/27/2030 | ||||||||||||||||||||||||||||||||||||||||||||||||||
| 38,309 | — | 42.42 | 2/27/2030 | ||||||||||||||||||||||||||||||||||||||||||||||||||
| 24,462 | 12,214 | 35.82 | 2/26/2031 | ||||||||||||||||||||||||||||||||||||||||||||||||||
| 8,584 | 17,119 | 47.54 | 2/25/2032 | ||||||||||||||||||||||||||||||||||||||||||||||||||
| 34,698 | — | 47.54 | 2/25/2032 | ||||||||||||||||||||||||||||||||||||||||||||||||||
| 7,765 | — | 69.17 | 2/24/2033 | ||||||||||||||||||||||||||||||||||||||||||||||||||
| — | 18,375 | 69.17 | 2/24/2033 | ||||||||||||||||||||||||||||||||||||||||||||||||||
| 2024 PROXY STATEMENT | | 60 | ||||||
| Option Awards | Stock Awards | ||||||||||||||||||||||||||||||||||||||||||||||||||||
| Name | Number of Securities Underlying Unexercised Options (#) Exercisable | Number of Securities Underlying Unexercised Options (#) Unexercisable (1) | Option Exercise Price ($) | Option Expiration Date | Number of Shares or Units of Stock That Have Not Vested (#)(2) | Market Value of Shares or Units of Stock That Have Not Vested ($)(3) | Equity Incentive Plan Awards: Number of Unearned Shares, Units or Other Rights That Have Not Vested (#)(4) | Equity Incentive Plan Awards: Market or Payout Value of Unearned Shares, Units or Other Rights That Have Not Vested ($)(3) | |||||||||||||||||||||||||||||||||||||||||||||
| Nicolas Papadopoulo | 9,213 | — | 20.84 | 5/13/2025 | 93,376 | 6,935,036 | 102,206 | 7,590,840 | |||||||||||||||||||||||||||||||||||||||||||||
| 21,930 | — | 23.90 | 5/13/2026 | ||||||||||||||||||||||||||||||||||||||||||||||||||
| 22,050 | — | 32.09 | 5/8/2027 | ||||||||||||||||||||||||||||||||||||||||||||||||||
| 150,000 | — | 32.13 | 9/19/2027 | ||||||||||||||||||||||||||||||||||||||||||||||||||
| 44,607 | — | 26.55 | 5/11/2028 | ||||||||||||||||||||||||||||||||||||||||||||||||||
| 47,408 | — | 32.67 | 2/28/2029 | ||||||||||||||||||||||||||||||||||||||||||||||||||
| 46,015 | — | 42.42 | 2/27/2030 | ||||||||||||||||||||||||||||||||||||||||||||||||||
| 43,489 | 21,713 | 35.82 | 2/26/2031 | ||||||||||||||||||||||||||||||||||||||||||||||||||
| 15,262 | 30,433 | 47.54 | 2/25/2032 | ||||||||||||||||||||||||||||||||||||||||||||||||||
| — | 31,264 | 69.17 | 2/24/2033 | ||||||||||||||||||||||||||||||||||||||||||||||||||
| Maamoun Rajeh | 15,930 | — | 32.09 | 5/8/2027 | 56,477 | 4,194,547 | 62,096 | 4,611,870 | |||||||||||||||||||||||||||||||||||||||||||||
| 31,500 | — | 32.13 | 9/19/2027 | ||||||||||||||||||||||||||||||||||||||||||||||||||
| 38,661 | — | 26.55 | 5/11/2028 | ||||||||||||||||||||||||||||||||||||||||||||||||||
| 41,087 | — | 32.67 | 2/28/2029 | ||||||||||||||||||||||||||||||||||||||||||||||||||
| 39,880 | — | 42.42 | 2/27/2030 | ||||||||||||||||||||||||||||||||||||||||||||||||||
| 63,308 | — | 35.82 | 2/26/2031 | ||||||||||||||||||||||||||||||||||||||||||||||||||
| 26,275 | 13,118 | 35.82 | 2/26/2031 | ||||||||||||||||||||||||||||||||||||||||||||||||||
| 9,220 | 18,387 | 47.54 | 2/25/2032 | ||||||||||||||||||||||||||||||||||||||||||||||||||
| — | 19,121 | 69.17 | 2/24/2033 | ||||||||||||||||||||||||||||||||||||||||||||||||||
| David E. Gansberg | 10,770 | — | 23.90 | 5/13/2026 | 56,477 | 4,194,547 | 62,096 | 4,611,870 | |||||||||||||||||||||||||||||||||||||||||||||
| 15,090 | — | 32.09 | 5/8/2027 | ||||||||||||||||||||||||||||||||||||||||||||||||||
| 15,822 | — | 26.55 | 5/11/2028 | ||||||||||||||||||||||||||||||||||||||||||||||||||
| 15,929 | — | 32.67 | 2/28/2029 | ||||||||||||||||||||||||||||||||||||||||||||||||||
| 8,972 | — | 41.43 | 10/1/2029 | ||||||||||||||||||||||||||||||||||||||||||||||||||
| 39,880 | — | 42.42 | 2/27/2030 | ||||||||||||||||||||||||||||||||||||||||||||||||||
| 26,275 | 13,118 | 35.82 | 2/26/2031 | ||||||||||||||||||||||||||||||||||||||||||||||||||
| 9,220 | 18,387 | 47.54 | 2/25/2032 | ||||||||||||||||||||||||||||||||||||||||||||||||||
| — | 19,121 | 69.17 | 2/24/2033 | ||||||||||||||||||||||||||||||||||||||||||||||||||
| 61 | | 2024 PROXY STATEMENT | | ||||||
| Option Awards | Stock Awards | |||||||||||||||||||||||||
| Name | Number of Shares Acquired on Exercise (#) | Value Realized on Exercise ($) | Number of Shares Acquired on Vesting (#) (1) | Value Realized on Vesting ($) | ||||||||||||||||||||||
| Marc Grandisson | — | — | 67,286 | 4,541,536 | ||||||||||||||||||||||
| François Morin | 10,680 | 524,805 | 18,621 | 1,256,728 | ||||||||||||||||||||||
| Nicolas Papadopoulo | — | — | 24,892 | 1,684,234 | ||||||||||||||||||||||
| Maamoun Rajeh | 35,940 | 1,936,337 | 19,516 | 1,317,384 | ||||||||||||||||||||||
| David E. Gansberg | 13,560 | 882,824 | 19,516 | 1,317,384 | ||||||||||||||||||||||
| Name | Executive Contributions in Last FY ($)(1) | Registrant Contributions in Last FY ($)(2) | Aggregate Earnings in Last FY ($) | Aggregate Withdrawals/Distributions ($) | Aggregate Balance at Last FYE ($)(3) | ||||||||||||||||||
| Marc Grandisson | — | — | — | — | — | ||||||||||||||||||
| François Morin | — | — | — | — | — | ||||||||||||||||||
| Nicolas Papadopoulo | — | — | — | — | — | ||||||||||||||||||
| Maamoun Rajeh | — | — | — | — | — | ||||||||||||||||||
| David E. Gansberg | 37,613 | 45,000 | 418,377 | — | 1,504,864 | ||||||||||||||||||
| 2024 PROXY STATEMENT | | 62 | ||||||
| 63 | | 2024 PROXY STATEMENT | | ||||||
| Name | Without Good Reason ($)(1)(2) | For Cause ($) | Death ($)(3) | Disability ($)(4) | Without Cause or For Good Reason (as applicable) ($) | Without Cause or For Good Reason (as applicable) following a Change in Control ($) | |||||||||||||||||
| Marc Grandisson | |||||||||||||||||||||||
| Cash Severance (5) | — | — | 6,350,000 | — | 8,575,000 | 8,575,000 | |||||||||||||||||
| Accelerated Vesting of Share-Based Awards (6) | — | — | 20,496,982 | 20,496,982 | — | 20,496,982 | |||||||||||||||||
| Health & Welfare (7) | — | — | 34,843 | 34,843 | 34,843 | 34,843 | |||||||||||||||||
| Total | — | — | 26,881,825 | 20,531,825 | 8,609,843 | 29,106,825 | |||||||||||||||||
| François Morin | |||||||||||||||||||||||
| Cash Severance (8) | — | — | — | — | 2,325,000 | 2,325,000 | |||||||||||||||||
| Accelerated Vesting of Share-Based Awards (6) | — | — | 5,577,025 | 5,577,025 | — | 5,577,025 | |||||||||||||||||
| Health & Welfare (7) | — | — | 34,282 | 34,282 | 34,282 | 34,282 | |||||||||||||||||
| Total | — | — | 5,611,307 | 5,611,307 | 2,359,282 | 7,936,307 | |||||||||||||||||
| Nicolas Papadopoulo | |||||||||||||||||||||||
| Cash Severance (8) | — | — | — | — | 2,953,750 | 2,953,750 | |||||||||||||||||
| Accelerated Vesting of Share-Based Awards (6) | — | — | 9,801,317 | 9,801,317 | — | 9,801,317 | |||||||||||||||||
| Health & Welfare (7) | — | — | 34,843 | 34,843 | 34,843 | 34,843 | |||||||||||||||||
| Total | — | — | 9,836,160 | 9,836,160 | 2,988,593 | 12,789,910 | |||||||||||||||||
| Maamoun Rajeh | |||||||||||||||||||||||
| Cash Severance (8) | — | — | — | — | 2,418,000 | 2,418,000 | |||||||||||||||||
| Accelerated Vesting of Share-Based Awards (6) | — | — | 5,940,323 | 5,940,323 | — | 5,940,323 | |||||||||||||||||
| Health & Welfare (7) | — | — | 35,581 | 35,581 | 35,581 | 35,581 | |||||||||||||||||
| Total | — | — | 5,975,904 | 5,975,904 | 2,453,581 | 8,393,904 | |||||||||||||||||
| David E. Gansberg | |||||||||||||||||||||||
| Cash Severance (9) | — | — | — | — | 2,964,000 | 2,964,000 | |||||||||||||||||
| Accelerated Vesting of Share-Based Awards (6) | — | — | 5,940,323 | 5,940,323 | 4,397,289 | 5,940,323 | |||||||||||||||||
| Health & Welfare (7) | — | — | 31,832 | 31,832 | 31,832 | 31,832 | |||||||||||||||||
| Total | — | — | 5,972,155 | 5,972,155 | 7,393,121 | 8,936,155 | |||||||||||||||||
| 2024 PROXY STATEMENT | | 64 | ||||||
| 65 | | 2024 PROXY STATEMENT | | ||||||
| Year | Summary Compensation Table Total for PEO(1) | Compensation Actually Paid to PEO(2) | Average Summary Compensation Table Total for Non-PEO NEOs(3) | Average Compensation Actually Paid to Non-PEO NEOs(4) | Value of Initial Fixed $100 Investment Based On: | |||||||||||||||||||||
| Total Shareholder Return(5) | Peer Group Total Shareholder Return(6) | Net Income (thousands)(7) | Operating ROE(8) | |||||||||||||||||||||||
| 2023 | 13,102,252 | 21,589,156 | 5,595,327 | 8,510,086 | 173.16 | 168.05 | 4,403,000 | 21.6 | % | |||||||||||||||||
| 2022 | 12,101,639 | 20,596,816 | 4,658,436 | 7,460,450 | 146.37 | 151.65 | 1,436,197 | 14.8 | % | |||||||||||||||||
| 2021 | 9,336,013 | 16,348,981 | 5,557,283 | 7,443,067 | 103.64 | 127.58 | 2,093,405 | 11.5 | % | |||||||||||||||||
| 2020 | 8,779,832 | 2,801,587 | 3,881,973 | 2,994,739 | 84.10 | 106.96 | 1,363,909 | 4.8 | % | |||||||||||||||||
| 2024 PROXY STATEMENT | | 66 | ||||||
| Year | Reported Summary Compensation Table Total for PEO | Reported Value of Equity Awards(a) | Equity Award Adjustments(b) | Reported Change in the Actuarial Present Value of Pension Benefits(c) | Pension Benefit Adjustments(c) | Compensation Actually Paid to PEO | ||||||||||||||
| 2023 | 13,102,252 | (6,551,061) | 15,037,965 | — | — | 21,589,156 | ||||||||||||||
| Year | Year End Fair Value of Outstanding and Unvested Equity Awards Granted in the Year(a) | Year over Year Change in Fair Value of Outstanding and Unvested Equity Awards Granted in Prior Years(a) | Fair Value as of Vesting Date of Equity Awards Granted and Vested in the Year | Year over Year Change in Fair Value of Equity Awards Granted in Prior Years and Vested in the Year(a) | Fair Value at the End of the Prior Year of Equity Awards that Failed to Meet Vesting Conditions in the Year | Value of Dividends or other Earnings Paid on Stock or Option Awards not Otherwise Reflected in Fair Value or Total Compensation | Total Equity Award Adjustments | ||||||||||||||||
| 2023 | 7,052,239 | 7,006,817 | — | 978,909 | — | — | 15,037,965 | ||||||||||||||||
| Year | Average Reported Summary Compensation Table Total for Non-PEO NEOs | Average Reported Value of Equity Awards(a) | Average Equity Award Adjustments(b) | Average Reported Change in the Actuarial Present Value of Pension Benefits(c) | Average Pension Benefit Adjustments(c) | Average Compensation Actually Paid to Non-PEO NEOs | ||||||||||||||
| 2023 | 5,595,327 | (2,140,451) | 5,055,210 | — | — | 8,510,086 | ||||||||||||||
| Year | Average Year End Fair Value of Outstanding and Unvested Equity Awards Granted in the Year(a) | Year over Year Average Change in Fair Value of Outstanding and Unvested Equity Awards Granted in Prior Years(a) | Average Fair Value as of Vesting Date of Equity Awards Granted and Vested in the Year | Year over Year Average Change in Fair Value of Equity Awards Granted in Prior Years and Vested in the Year(a) | Average Fair Value at the End of the Prior Year of Equity Awards that Failed to Meet Vesting Conditions in the Year | Average Value of Dividends or other Earnings Paid on Stock or Option Awards not Otherwise Reflected in Fair Value or Total Compensation | Total Average Equity Award Adjustments | ||||||||||||||||
| 2023 | 2,304,202 | 2,477,790 | — | 273,218 | — | — | 5,055,210 | ||||||||||||||||
| 67 | | 2024 PROXY STATEMENT | | ||||||
| Compensation Actually Paid vs. Cumulative TSR | ||
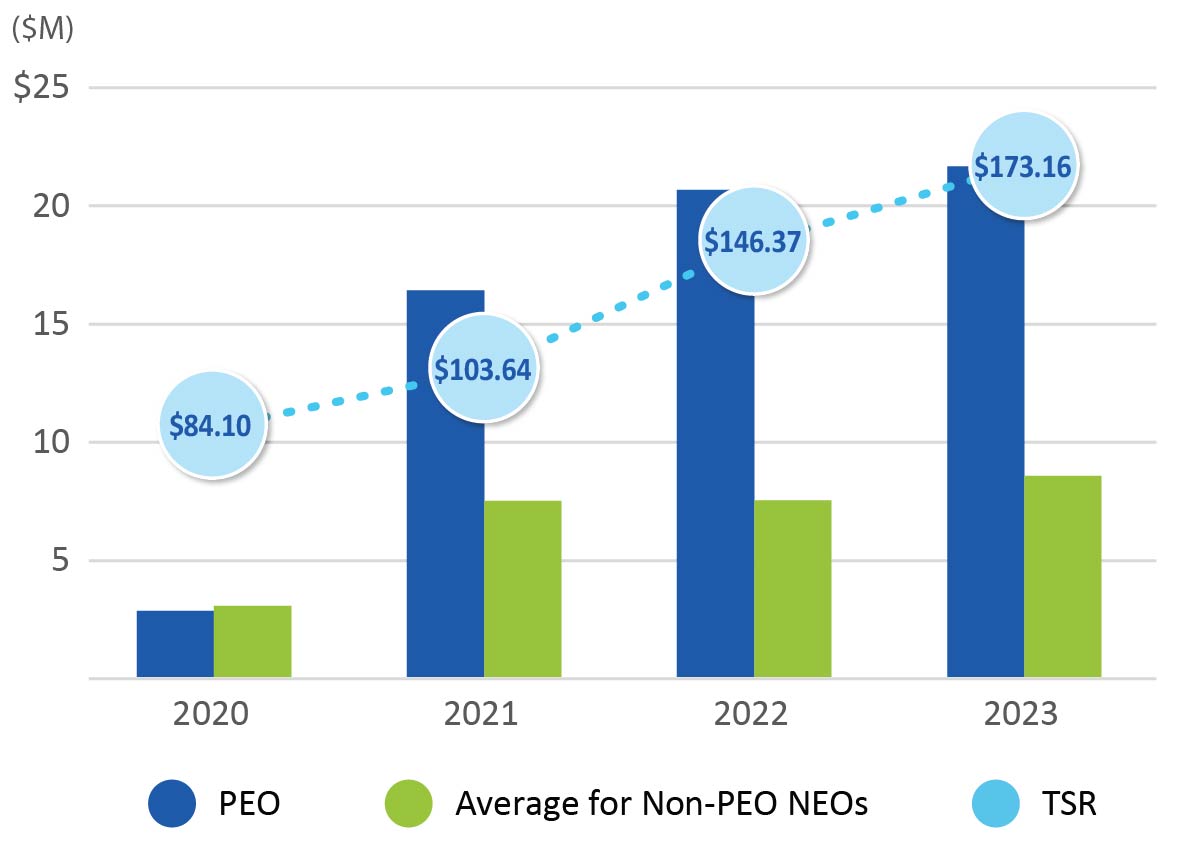
| Compensation Actually Paid vs. Net Income | ||
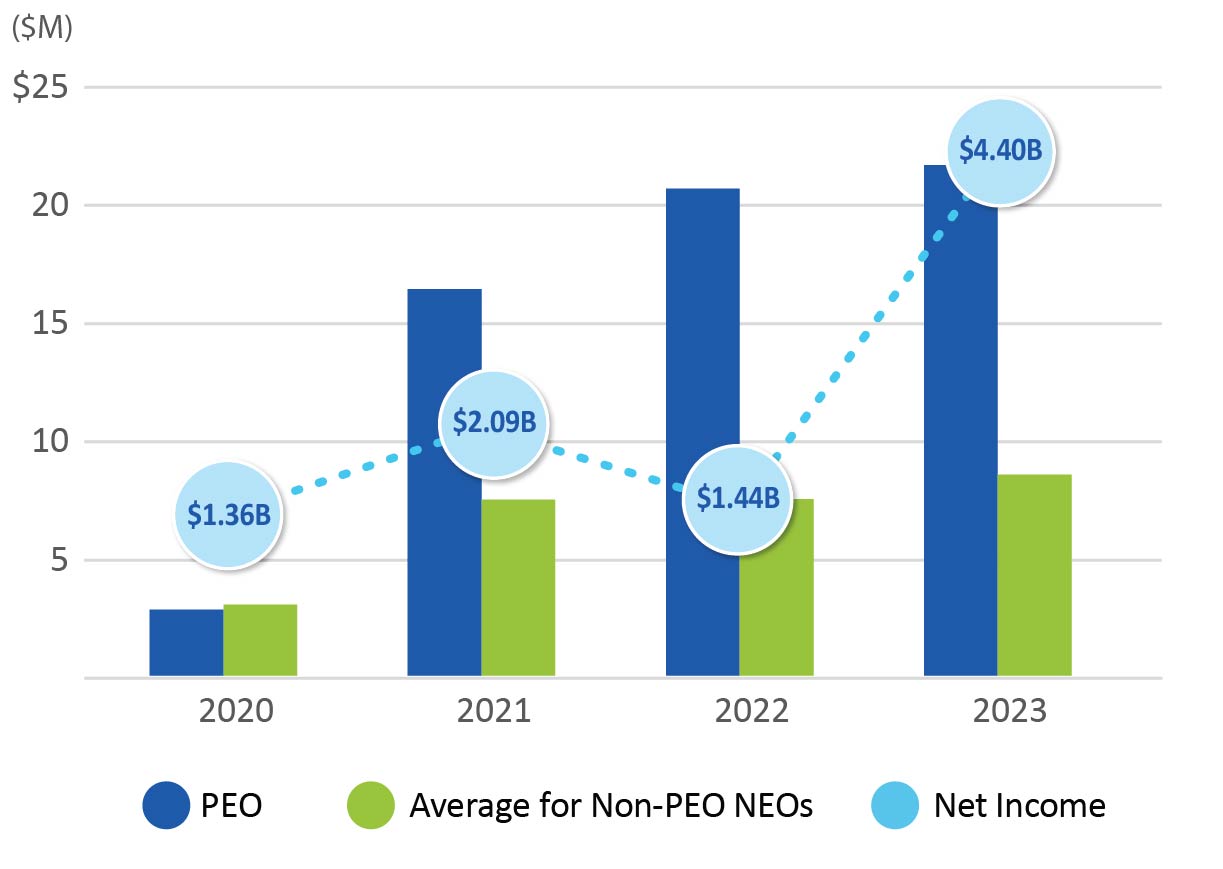
| 2024 PROXY STATEMENT | | 68 | ||||||
| Compensation Actually Paid vs. Operating ROE | ||
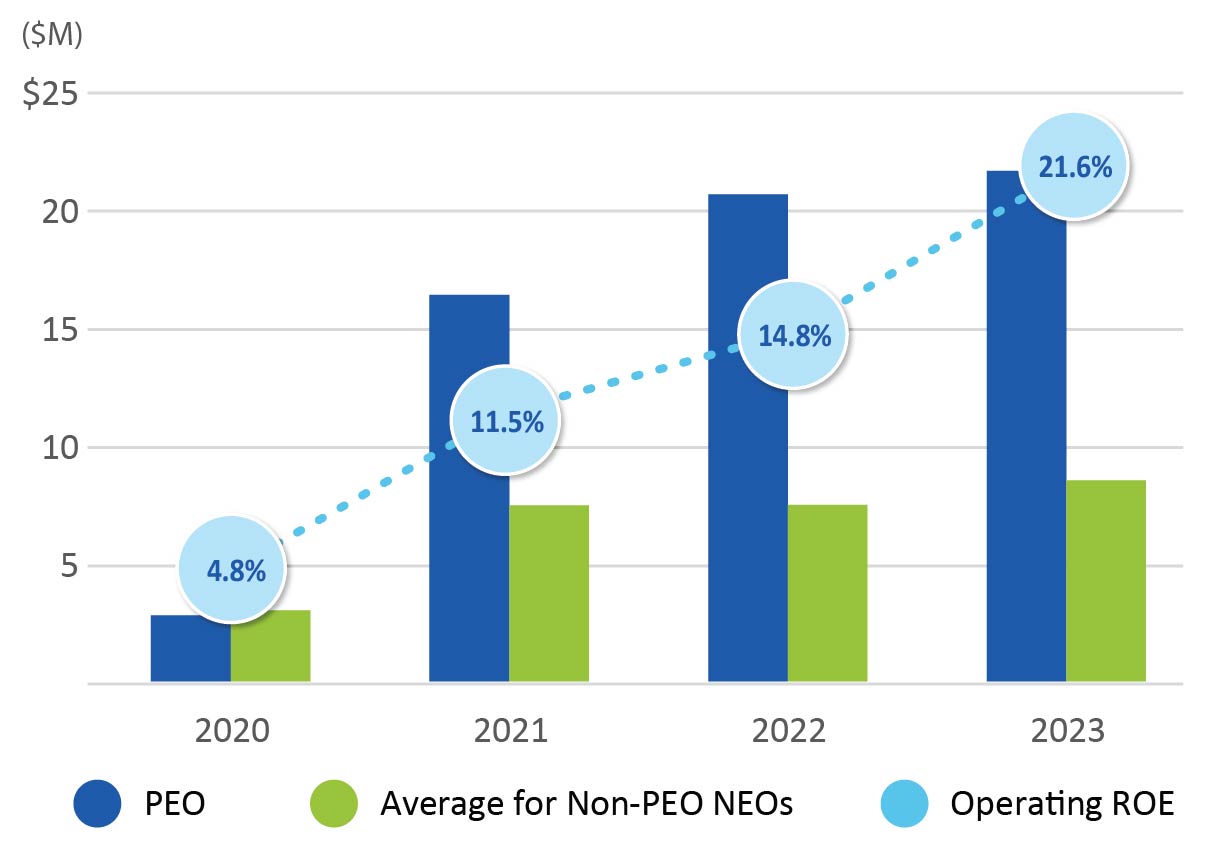
| Total Shareholder Return | ||
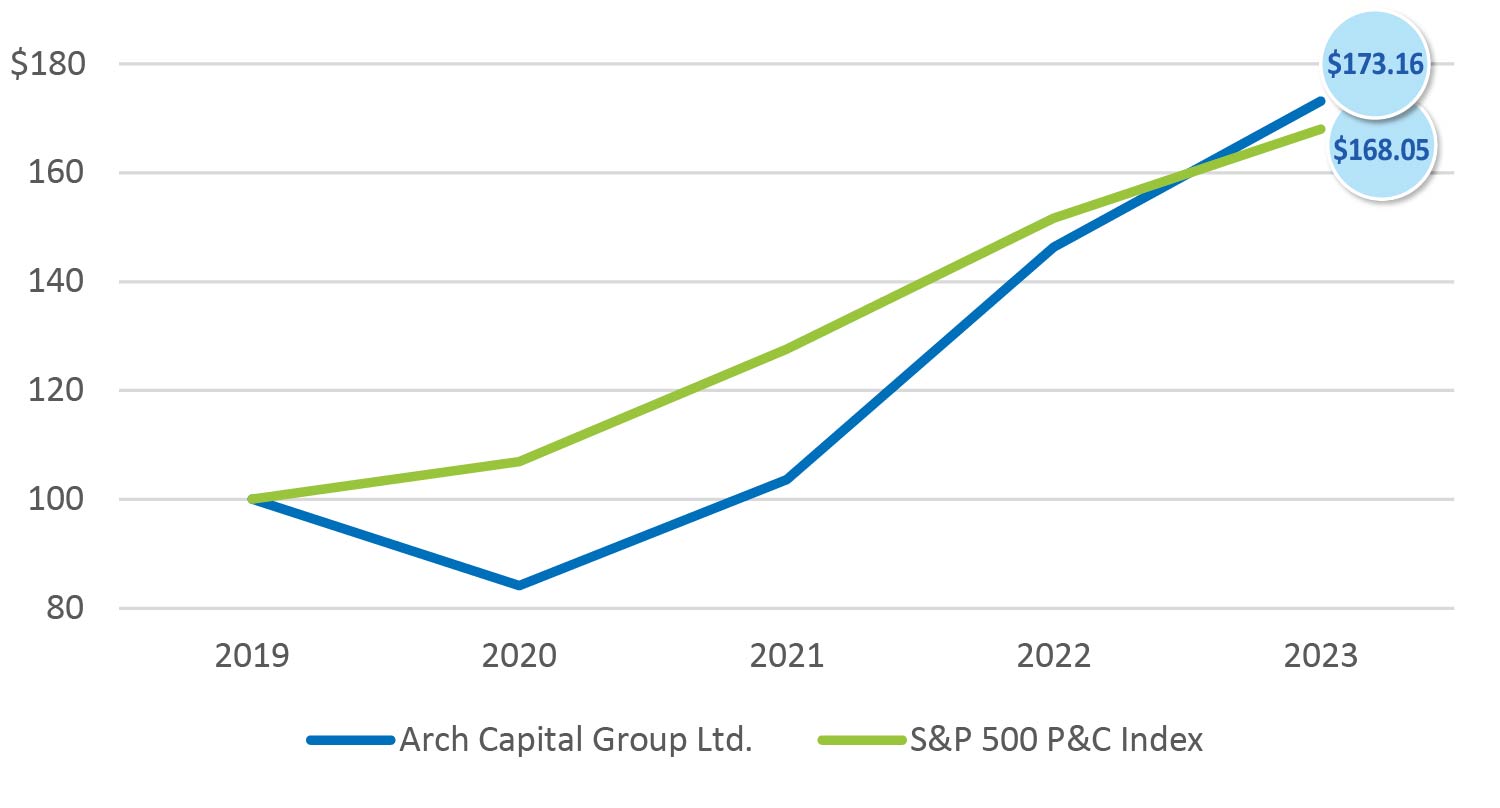
| 69 | | 2024 PROXY STATEMENT | | ||||||
| 2024 PROXY STATEMENT | | 70 | ||||||
| 71 | | 2024 PROXY STATEMENT | | ||||||
| 2024 PROXY STATEMENT | | 72 | ||||||
| 73 | | 2024 PROXY STATEMENT | | ||||||
| AUDIT COMMITTEE Eileen Mallesch (Chair) Francis Ebong Laurie S. Goodman Moira Kilcoyne Eugene S. Sunshine | ||||||||
| ||
| 2024 PROXY STATEMENT | | 74 | ||||||
| Year Ended December 31, | |||||||||||
| 2023 | 2022 | Description | |||||||||
| Audit Fees | $ | 11,306,885 | $ | 10,353,246 | Includes fees for the integrated audit of our annual financial statements and internal control over financial reporting, review of our financial statements included in our quarterly reports on Form 10-Q and statutory audits for our insurance subsidiaries. Audit fees for the year ended December 31, 2023 increased when compared to prior year primarily due to changes in local regulations resulting in increased reporting requirements in 2023. | ||||||
| Audit Related Fees | 612,259 | 168,988 | Includes fees for assurance and related services that are traditionally performed by independent accountants, including employee benefit plan audits, due diligence related to M&A, regulatory and compliance attestations and agreed-upon procedures not required by regulation. Audit related fees for the year ended December 31, 2023 increased when compared to prior year primarily due to proactive assurance services related to a new system implementation and AUP procedures performed for BMIR. | ||||||||
| Tax Fees | 1,224,008 | 302,977 | Fees for tax services consists primarily of fees for tax compliance, tax advice and tax planning. Tax fees for the year ended December 31, 2023 increased when compared to prior year primarily due to services provided for various tax consulting projects. | ||||||||
| All Other Fees | 47,037 | 31,151 | Fees for services that are not included in the above categories consisted primarily of software licenses and professional services rendered in connection with various consulting. | ||||||||
| Total | $ | 13,190,189 | $ | 10,856,362 | |||||||
| Year Ended December 31, | |||||||
| 2017 | 2016 | Description | |||||
| Audit Fees | $ | 8,440,876 | $ | 6,918,268 | Includes fees for the integrated audit of our annual financial statements and internal control over financial reporting, review of our financial statements included in our quarterly reports on Form 10-Q, statutory audits for our insurance subsidiaries and review of SEC registration statements. Audit fees for the year ended December 31, 2017 increased primarily due to fees associated with growth in Arch Mortgage Insurance as a result of the UGC acquisition, common and preferred share issuance costs, the impact of tax reform and non-recurring transactions in 2017. | ||
| Audit Related Fees | 271,867 | 212,708 | Fees consisted of the audit of the Company’s benefit plans and other audit related services. | ||||
| Tax Fees | 584,438 | 656,571 | Fees for tax services, including tax compliance, tax advice and tax planning. | ||||
| All Other Fees | 58,216 | 37,933 | Fees for services that are not included in the above categories and primarily include fees related to software licensing fees. | ||||
| Total (1) | $ | 9,355,397 | $ | 7,825,480 | |||
| 75 | ||||||||
| | |||||||
| THE BOARD UNANIMOUSLY RECOMMENDS THAT YOU VOTE “FOR” THIS PROPOSAL. | ||||
| ||
| |
| |||||||
| Total shares underlying outstanding stock options | 6,668,045 | |||
| Weighted average exercise price of outstanding stock options | $ | 53.05 | ||
| Weighted average remaining contractual life of outstanding stock options | 5.32 | |||
| Total shares underlying outstanding unvested restricted stock and restricted stock unit awards | 980,157 | |||
| Total shares currently available for grant under existing plans | 1,594,277 | |||
| Remaining full value shares available for grant under existing plans | 881,733 | |||
| Total shares of common stock outstanding as of March 14, 2018 | 136,702,745 | |||
| Year | Total Shares Subject to Options | Total Shares Subject to Full Value Awards | Weighted Average Common Shares Outstanding | Annual Burn Rate | Annual Burn Rate (full value awards counted as 3.5 shares) | |||||
| 2017 | 843,690 | 582,392 | 134,712,788 | 1.06 | % | 2.14 | % | |||
| 2016 | 696,817 | 480,980 | 120,792,114 | 0.98 | % | 1.97 | % | |||
| 2015 | 693,107 | 571,978 | 121,786,127 | 1.04 | % | 2.21 | % | |||
| Average Three-Year Burn Rate | 2.11 | % | ||||||||
| ||
| ||
| ||
| ||
| ||
| 76 | |||
| Column A | Column B | Column C | |||||||
| Plan Category | Number of Securities to be Issued Upon Exercise of Outstanding Stock Options(1), Warrants and Rights (a) | Weighted-Average Exercise Price of Outstanding Stock Options(1), Warrants and Rights ($) | Number of Securities Remaining Available for Future Issuance Under Equity Compensation Plans (Excluding Securities Reflected in Column (a)) (c) | ||||||
| Equity compensation plans approved by security holders | 6,894,554 | 51.67 | 2,998,321 | ||||||
| Equity compensation plans not approved by security holders | — | — | — | ||||||
| Total | 6,894,554 | 51.67 | 2,998,321 | (2) | |||||
| ||
| |
| ||
| ||
| |
| Arch Capital Holdings Ltd. | Arch Investment Management Ltd. | |||||||
| François Morin; Christine Todd | ||||||||
| Arch Credit Risk Services (Bermuda) Ltd. | Arch Global Services Holdings Ltd. | |||||||
| Brian Chen; Seamus Fearon; Alan Tiernan | Chris Hovey; François Morin | |||||||
| Arch Investment Property Holdings Ltd. | Alternative Re Holdings Limited, Alternative Re Limited | |||||||
| François Morin; Chiara Nannini | ||||||||
| Arch Reinsurance Ltd. | Arch Underwriters Ltd. | |||||||
| Crystal Doughty; Matthew Dragonetti; Jerome Halgan; Maamoun Rajeh; William Soares | Crystal Doughty; Matthew Dragonetti; Jerome Halgan; Maamoun Rajeh | |||||||
| Arch Investment Holdings I Ltd., Arch Investment Holdings II Ltd., Arch Investment Holdings III Ltd., Arch Investment Holdings IV Ltd. | ||||||||
| Other Non-U.S. Subsidiaries, as Required or Designated Under Bye-Law 75 (except as otherwise indicated herein) | ||||||||
| François Morin; | François Morin; Maamoun Rajeh | |||||||
| 77 | ||||||||
| | |||||||
| ||
| ||
| ||
| ||
| 2024 PROXY STATEMENT | | 78 | ||||||||
| THE BOARD UNANIMOUSLY RECOMMENDS THAT YOU VOTE “FOR” THIS PROPOSAL. | ||||
| 79 | ||||||||
| | |||||||
 | Internet Availability of Proxy Materials | ||||||||
 | Shareholders Entitled to Vote and Voting Standard | ||||||||
| 2024 PROXY STATEMENT | | A-1 | ||||||
| ||
Via the Internet:Visit  By Phone:Call 1-800-690-6903 and follow the voice prompts.
 By Mail: Sign, date and return the proxy card.
 By QR Code: Scan the QR Code on your proxy card, Notice or Voting Instruction Form to vote with your mobile device.
 | Quorum; Votes Required for Approval | ||||||||
| A-2 | | 2024 PROXY STATEMENT | | ||||||
|
 | Effect of Your Proxy | ||||||||
 | Effect of Not Casting Your Vote | ||||||||
 | Revoking Your Proxy or Changing Your Vote | ||||||||
| ||
 | 2024 PROXY STATEMENT | | |||||||
| A-3 | ||||||||
 | Annual Meeting Attendance | ||||||||
 | Limitation on Voting Under Our Bye-laws | ||||||||
|
 | Proxy Solicitation | ||||||||
| A-4 | | 2024 PROXY STATEMENT | | ||||||
 | Corporate Governance Materials | ||||||||
 | Reduce Duplicate Mailings | ||||||||
| ||
 | Shareholder Proposals for the | ||||||||
| 2024 PROXY STATEMENT | | A-5 | ||||||
 | Contacting Our Board, Individual Directors and Committees | ||||||||
 | Registered and Principal Executive Offices | ||||||||
| Our registered office is located at: | Our principal executive offices are located at: | ||||
Clarendon House 2 Church Street Hamilton HM 11, Bermuda Phone: (441) 295-1422 | Waterloo House, Ground Floor 100 Pitts Bay Road Pembroke HM 08, Bermuda Phone: (441) 278-9250 | ||||
| A-6 | | 2024 PROXY STATEMENT | | ||||||
| ||
| ||
| ||
| ||
| ||
| ||
| ||
| ||
| ||
| ||
| ||
| ||
| Year Ended | ||||||||||||||||||||||||||||||||||||||
| December 31, | ||||||||||||||||||||||||||||||||||||||
| (in millions) | 2023 | 2022 | 2021 | 2020 | 2019 | 2018 | 2017 | 2016 | 2015 | 2014 | ||||||||||||||||||||||||||||
| Net income available to Arch common shareholders (a) | $4,403 | $1,436 | $2,093 | $1,364 | $1,595 | $714 | $567 | $665 | $516 | $812 | ||||||||||||||||||||||||||||
| Net realized (gains) losses | 165 | 663 | (307) | (815) | (350) | 301 | (142) | (47) | 129 | (100) | ||||||||||||||||||||||||||||
| Equity in net (income) of investment funds accounted for using the equity method | (278) | (115) | (366) | (147) | (124) | (46) | (142) | (48) | (25) | (20) | ||||||||||||||||||||||||||||
| Net foreign exchange losses (gains) | 62 | (102) | (43) | 81 | 11 | (60) | 114 | (32) | (63) | (83) | ||||||||||||||||||||||||||||
| Transaction costs and other | 6 | — | 1 | 10 | 14 | 12 | 22 | 42 | — | — | ||||||||||||||||||||||||||||
| Loss on redemption of preferred shares | — | — | 15 | — | — | 3 | 7 | — | — | — | ||||||||||||||||||||||||||||
| Income tax expense (benefit) | (1,157) | (42) | 42 | 64 | 16 | (15) | 22 | (2) | 9 | 7 | ||||||||||||||||||||||||||||
| After-tax operating income available to Arch common shareholders (b) | $3,201 | $1,840 | $1,435 | $557 | $1,163 | $909 | $447 | $577 | $565 | $617 | ||||||||||||||||||||||||||||
| Beginning common shareholders’ equity | $12,080 | $12,716 | $12,326 | $10,717 | $8,660 | $8,324 | $7,481 | $5,842 | $5,767 | $5,284 | ||||||||||||||||||||||||||||
| Ending common shareholders’ equity | 17,523 | 12,080 | 12,716 | 12,326 | 10,717 | 8,660 | 8,324 | 7,481 | 5,842 | 5,767 | ||||||||||||||||||||||||||||
| Average common shareholders’ equity (c) | $14,802 | $12,398 | $12,521 | $11,522 | $9,689 | $8,492 | $7,903 | $6,114 | $5,804 | $5,525 | ||||||||||||||||||||||||||||
| Annualized return on average common equity (a)/(c) | 29.7% | 11.6% | 16.7% | 11.8% | 16.5% | 8.4% | 7.2% | 10.9% | 8.9% | 14.7% | ||||||||||||||||||||||||||||
| Annualized operating return on average common equity (b)/(c) | 21.6% | 14.8% | 11.5% | 4.8% | 12.0% | 10.7% | 5.7% | 9.4% | 9.7% | 11.2% | ||||||||||||||||||||||||||||
| Year Ended | |||||||
| December 31, | December 31, | ||||||
| (U.S. Dollars in thousands, except share data) | 2017 | 2016 | |||||
| Net income available to Arch common shareholders (a) | $ | 566,502 | $ | 664,668 | |||
| Net realized (gains) losses | (148,836 | ) | (77,081 | ) | |||
| Net impairment losses recognized in earnings | 7,138 | 30,442 | |||||
| Equity in net (income) loss of investment funds accounted for using the equity method | (142,286 | ) | (48,475 | ) | |||
| Net foreign exchange losses (gains) | 113,613 | (31,987 | ) | ||||
| UGC transaction costs and other | 22,150 | 41,729 | |||||
| Loss on redemption of preferred shares | 6,735 | — | |||||
| Income tax expense (benefit) | 22,139 | (1,852 | ) | ||||
| After-tax operating income available to Arch common shareholders (b) | $ | 447,155 | $ | 577,444 | |||
| Beginning common shareholders’ equity | $ | 7,481,163 | $ | 5,841,542 | |||
| Ending common shareholders’ equity | 8,324,047 | 7,481,163 | |||||
| Average common shareholders’ equity (1) (c) | $ | 7,902,605 | $ | 6,113,718 | |||
| Annualized return on average common equity (a)/(c) | 7.2 | % | 10.9 | % | |||
| Annualized operating return on average common equity (b)/(c) | 5.7 | % | 9.4 | % | |||
| ||||||||
| Year Ended | |||||||
| December 31, | December 31, | ||||||
| (U.S. Dollars in thousands, except share data) | 2017 | 2016 | |||||
| Total shareholders’ equity available to Arch | $ | 9,196,602 | $ | 8,253,718 | |||
| Less preferred shareholders’ equity | 872,555 | 772,555 | |||||
| Common shareholders’ equity available to Arch (a) | $ | 8,324,047 | $ | 7,481,163 | |||
| Less: goodwill and intangible assets | 645,802 | 774,744 | |||||
| Common shareholders’ equity available to Arch less goodwill and intangible assets (b) | $ | 7,678,245 | $ | 6,706,419 | |||
| Common shares and common share equivalents outstanding, net of treasury shares (c) | 136,652,139 | 135,550,337 | |||||
| Book value per common share (a)/(c) | $ | 60.91 | $ | 55.19 | |||
| Tangible book value per common share (b)/(c) | $ | 56.19 | $ | 49.48 | |||
| Year Ended | |||||||||||||||||||||||||||||||||||||||||||||||||||||||||||||||||||||||
| December 31 | |||||||||||||||||||||||||||||||||||||||||||||||||||||||||||||||||||||||
| (in millions, except per share amounts) | 2023 | 2022 | 2021 | 2020 | 2019 | 2001 | |||||||||||||||||||||||||||||||||||||||||||||||||||||||||||||||||
| Total shareholders’ equity available to Arch | $18,353 | $12,910 | $13,546 | $13,106 | $11,497 | $1,020 | |||||||||||||||||||||||||||||||||||||||||||||||||||||||||||||||||
| Less preferred shareholders’ equity | 830 | 830 | 830 | 780 | 780 | — | |||||||||||||||||||||||||||||||||||||||||||||||||||||||||||||||||
| Common shareholders’ equity available to Arch (a) | $17,523 | $12,080 | $12,716 | $12,326 | $10,717 | $1,020 | |||||||||||||||||||||||||||||||||||||||||||||||||||||||||||||||||
| Less: goodwill and intangible assets | 730 | 802 | 942 | 682 | 731 | 26 | |||||||||||||||||||||||||||||||||||||||||||||||||||||||||||||||||
| Common shareholders’ equity available to Arch less goodwill and intangible assets (b) | $16,793 | $11,278 | $11,774 | $11,644 | $9,986 | $994 | |||||||||||||||||||||||||||||||||||||||||||||||||||||||||||||||||
| Common shares and common share equivalents outstanding, net of treasury shares (c) | 373.3 | 370.3 | 378.9 | 406.7 | 405.6 | 502.2 | |||||||||||||||||||||||||||||||||||||||||||||||||||||||||||||||||
| Book value per common share (a)/(c) | $46.94 | $32.62 | $33.56 | $30.31 | $26.42 | $2.03 | |||||||||||||||||||||||||||||||||||||||||||||||||||||||||||||||||
| Tangible book value per common share (b)/(c) | $44.99 | $30.45 | $31.07 | $28.63 | $24.62 | $1.98 | |||||||||||||||||||||||||||||||||||||||||||||||||||||||||||||||||
| B-2 | ||||||||
| | | | |||||||